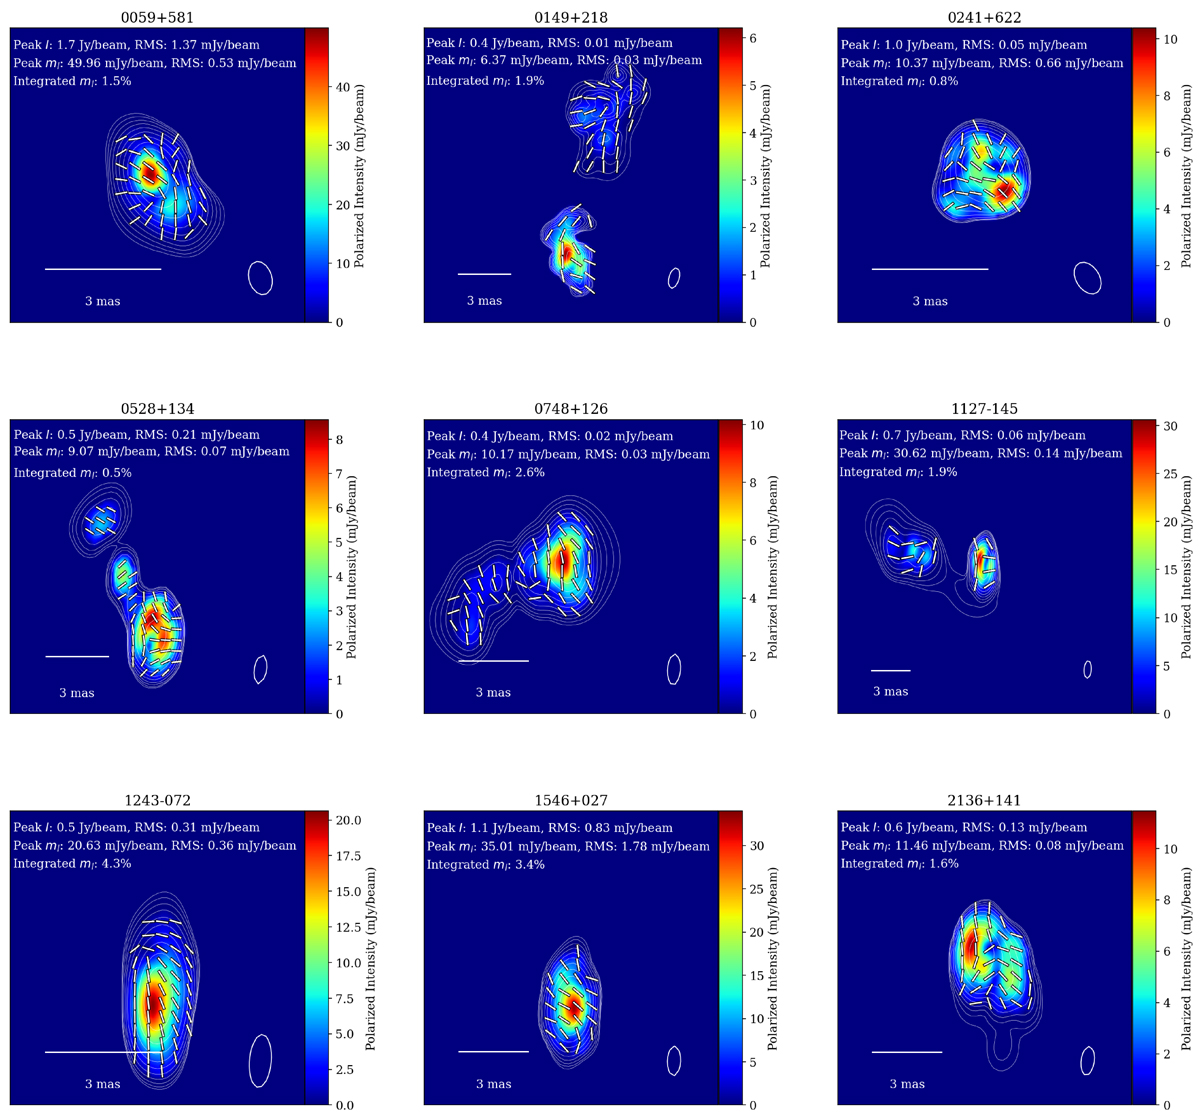
Fig. 3.
Download original image
Reconstruction of data from 6–7 Jan. 2022 for nine target sources: 0059+581, 0149+218, 0241+622, 0528+134, 0748+126, 1127–145, 1243–072, 1546+027, and 2136+141. The figure shows maps for each source in linear polarization at 15 GHz (color coding: blue-low and red-high). The total intensity is indicated in white contours on each map. The contours are the [0.1%,0.2%,0.4%,…,25.6%,51.2%] levels of the peak brightness. The orientation of the linear electric vector position angle is plotted as white ticks, the total polarized intensity by the colormap. An individual convolution beam (natural weighting) is shown in the lower right corner of each map. The field of view is shown by the scale with 3 mas in the lower left.
Current usage metrics show cumulative count of Article Views (full-text article views including HTML views, PDF and ePub downloads, according to the available data) and Abstracts Views on Vision4Press platform.
Data correspond to usage on the plateform after 2015. The current usage metrics is available 48-96 hours after online publication and is updated daily on week days.
Initial download of the metrics may take a while.