Open Access
Fig. 9
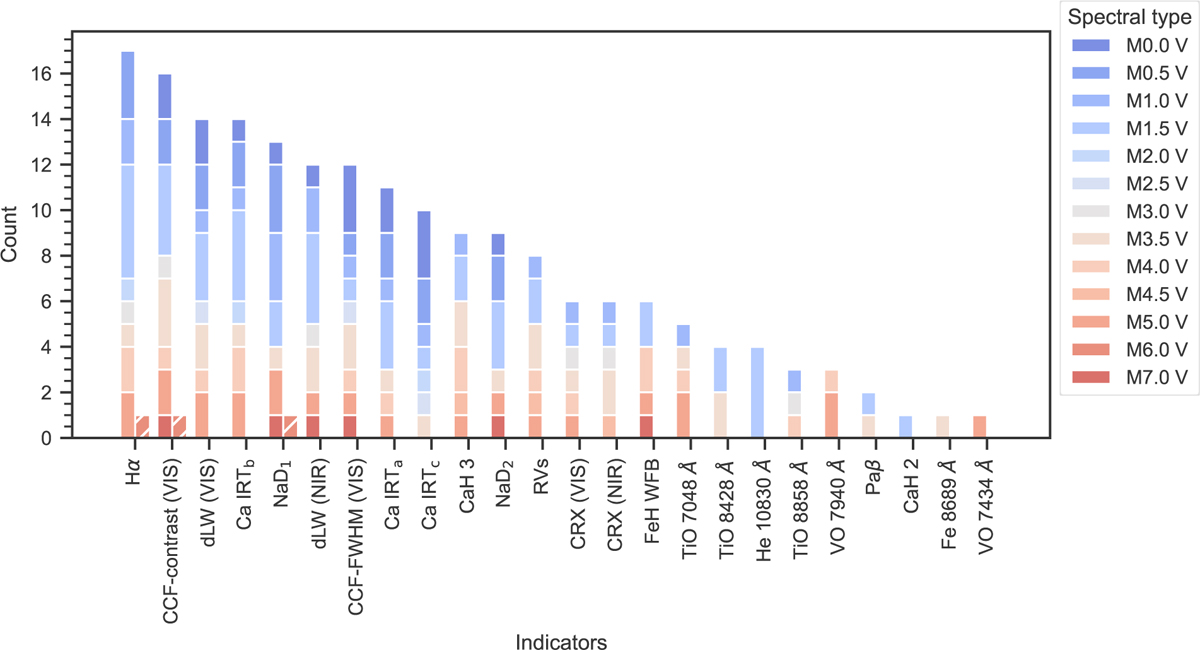
Download original image
Histogram of the activity indicators that appear in clusters of long-term signals. The different colours show the total counts in each bar, differentiated by stellar spectral type. We distinguish between inactive and active (pEW(Hα) < −0.5 Å) stars by using solid and hatched bars, respectively.
Current usage metrics show cumulative count of Article Views (full-text article views including HTML views, PDF and ePub downloads, according to the available data) and Abstracts Views on Vision4Press platform.
Data correspond to usage on the plateform after 2015. The current usage metrics is available 48-96 hours after online publication and is updated daily on week days.
Initial download of the metrics may take a while.