Fig. B.1
Download original image
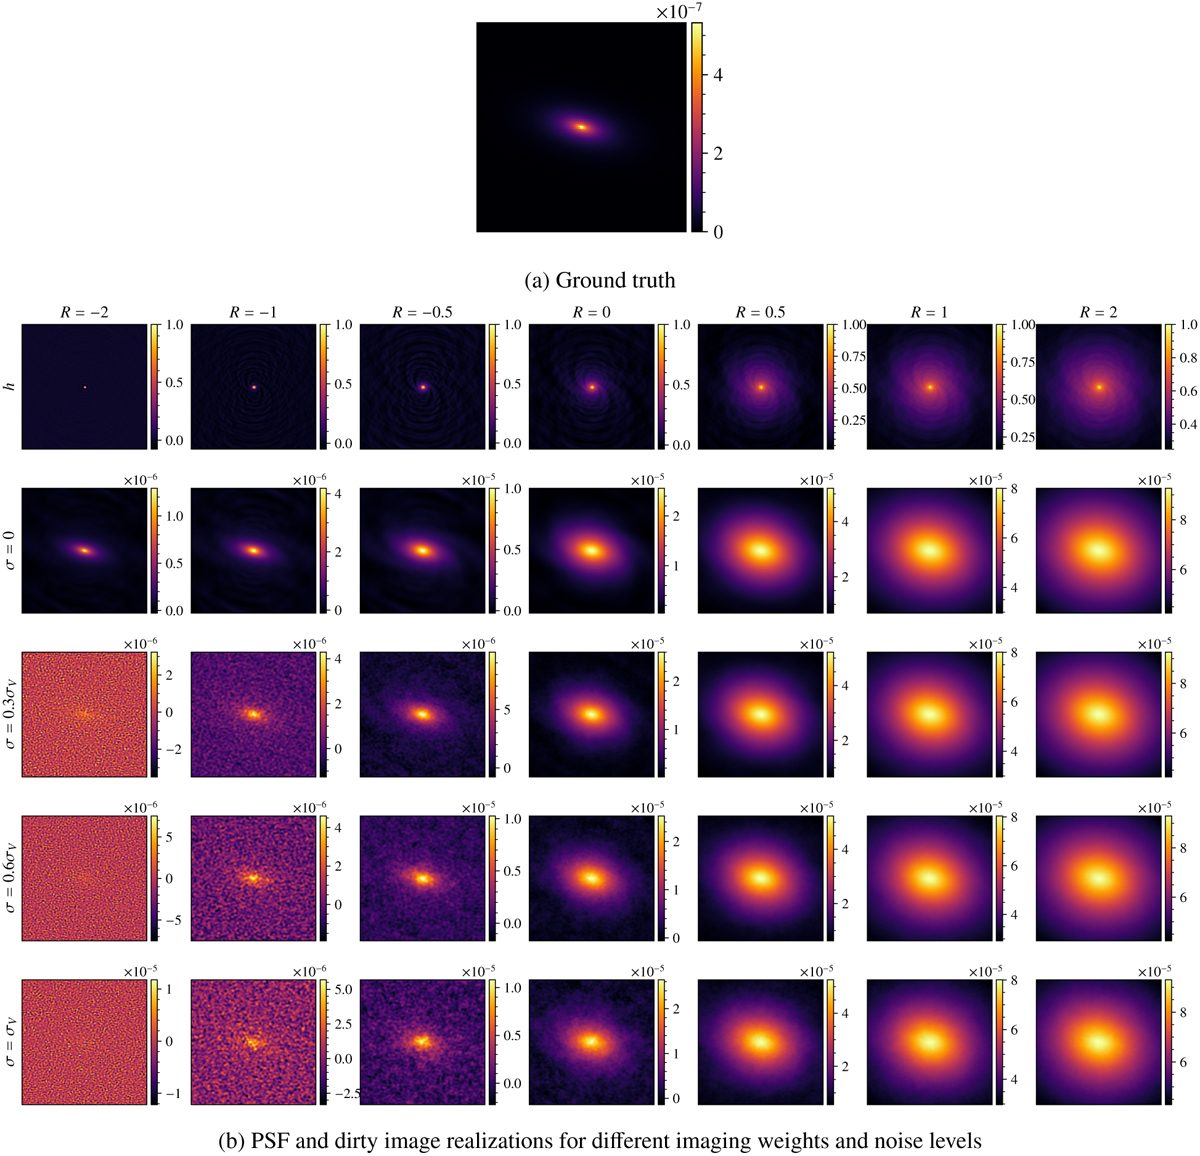
Example galaxy from the T-RECS catalog with I = 168 μJy and ϵtrue = (0.32, 0.16). The ground truth is plotted in Fig. B.1a. The top row of Fig. B.1b shows the associated PSFs. The second to the fourth row of Fig. B.1b show the dirty images for different noise levels (actual noise level mentioned in the legend) with noise increasing from top to bottom. σV corresponds to the expected visibility noise level calculated using Eq. 25. Different columns correspond to different values of R.
Current usage metrics show cumulative count of Article Views (full-text article views including HTML views, PDF and ePub downloads, according to the available data) and Abstracts Views on Vision4Press platform.
Data correspond to usage on the plateform after 2015. The current usage metrics is available 48-96 hours after online publication and is updated daily on week days.
Initial download of the metrics may take a while.