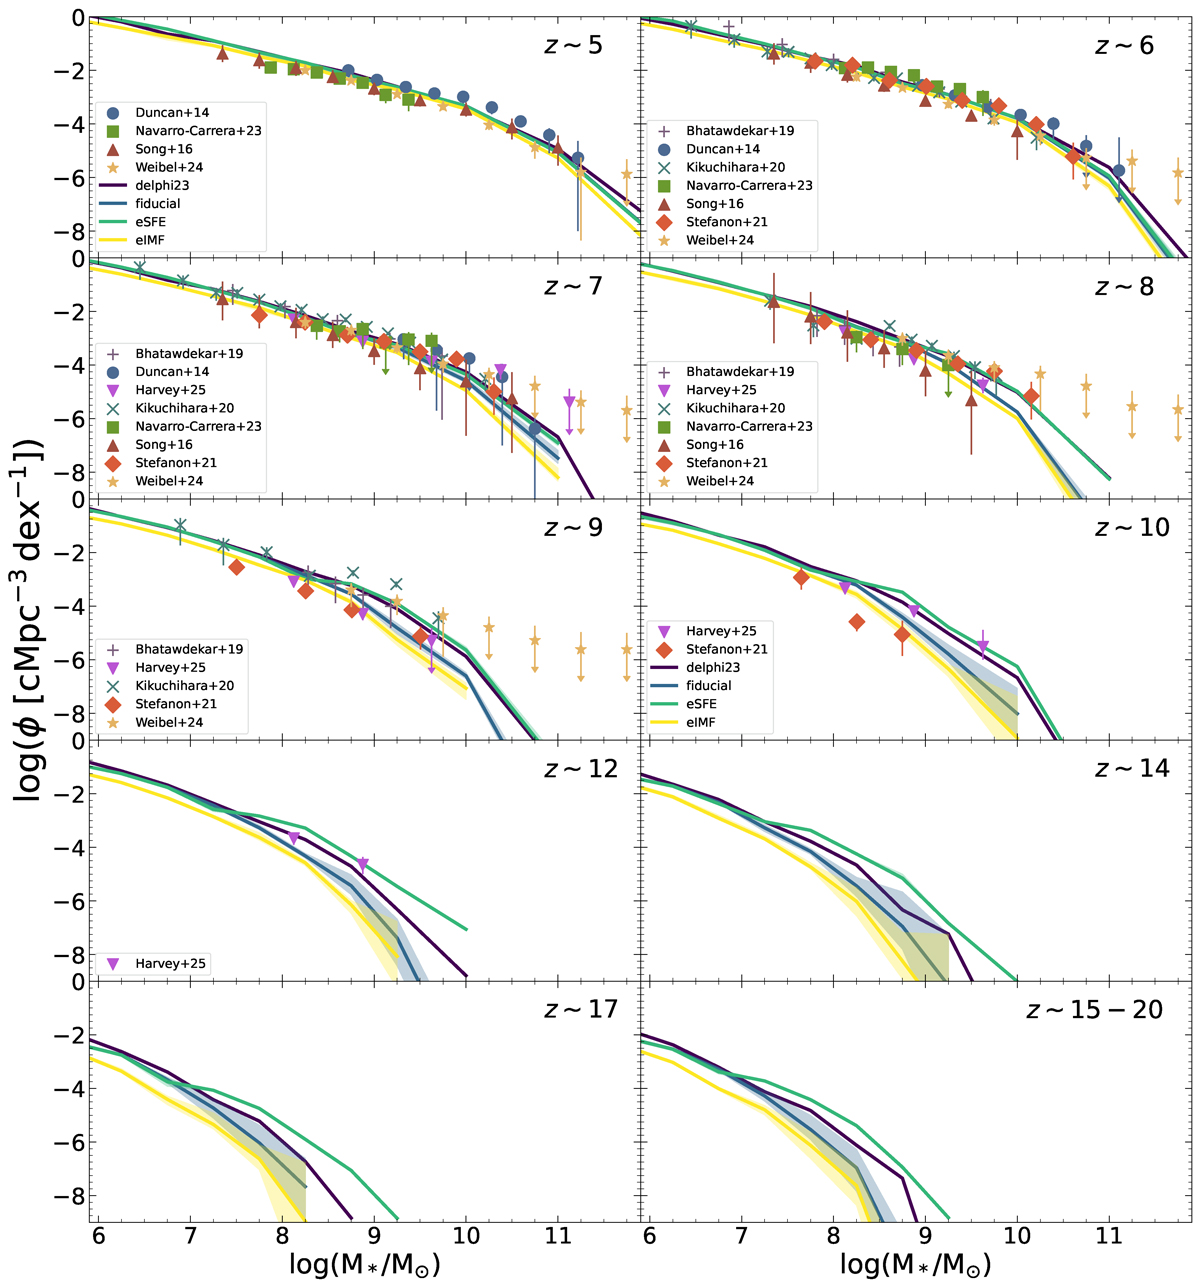
Fig. 9.
Download original image
Redshift evolution of the SMF at z ∼ 5 − 20, for the different model explored in this work. Solid lines show the mean results from five runs of each model with shaded areas showing the associated maximum and minimum values. The bottom right panel shows the SMF integrated on all outputs between redshifts 15 and 20. As marked, each panel up to z ∼ 12 show observational data, all assuming a Kroupa IMF (from Bhatawdekar et al. 2019; Duncan et al. 2014; Kikuchihara et al. 2020; Navarro-Carrera et al. 2024; Song et al. 2016; Stefanon et al. 2021; Weibel et al. 2024; Harvey et al. 2025).
Current usage metrics show cumulative count of Article Views (full-text article views including HTML views, PDF and ePub downloads, according to the available data) and Abstracts Views on Vision4Press platform.
Data correspond to usage on the plateform after 2015. The current usage metrics is available 48-96 hours after online publication and is updated daily on week days.
Initial download of the metrics may take a while.