Fig. 7.
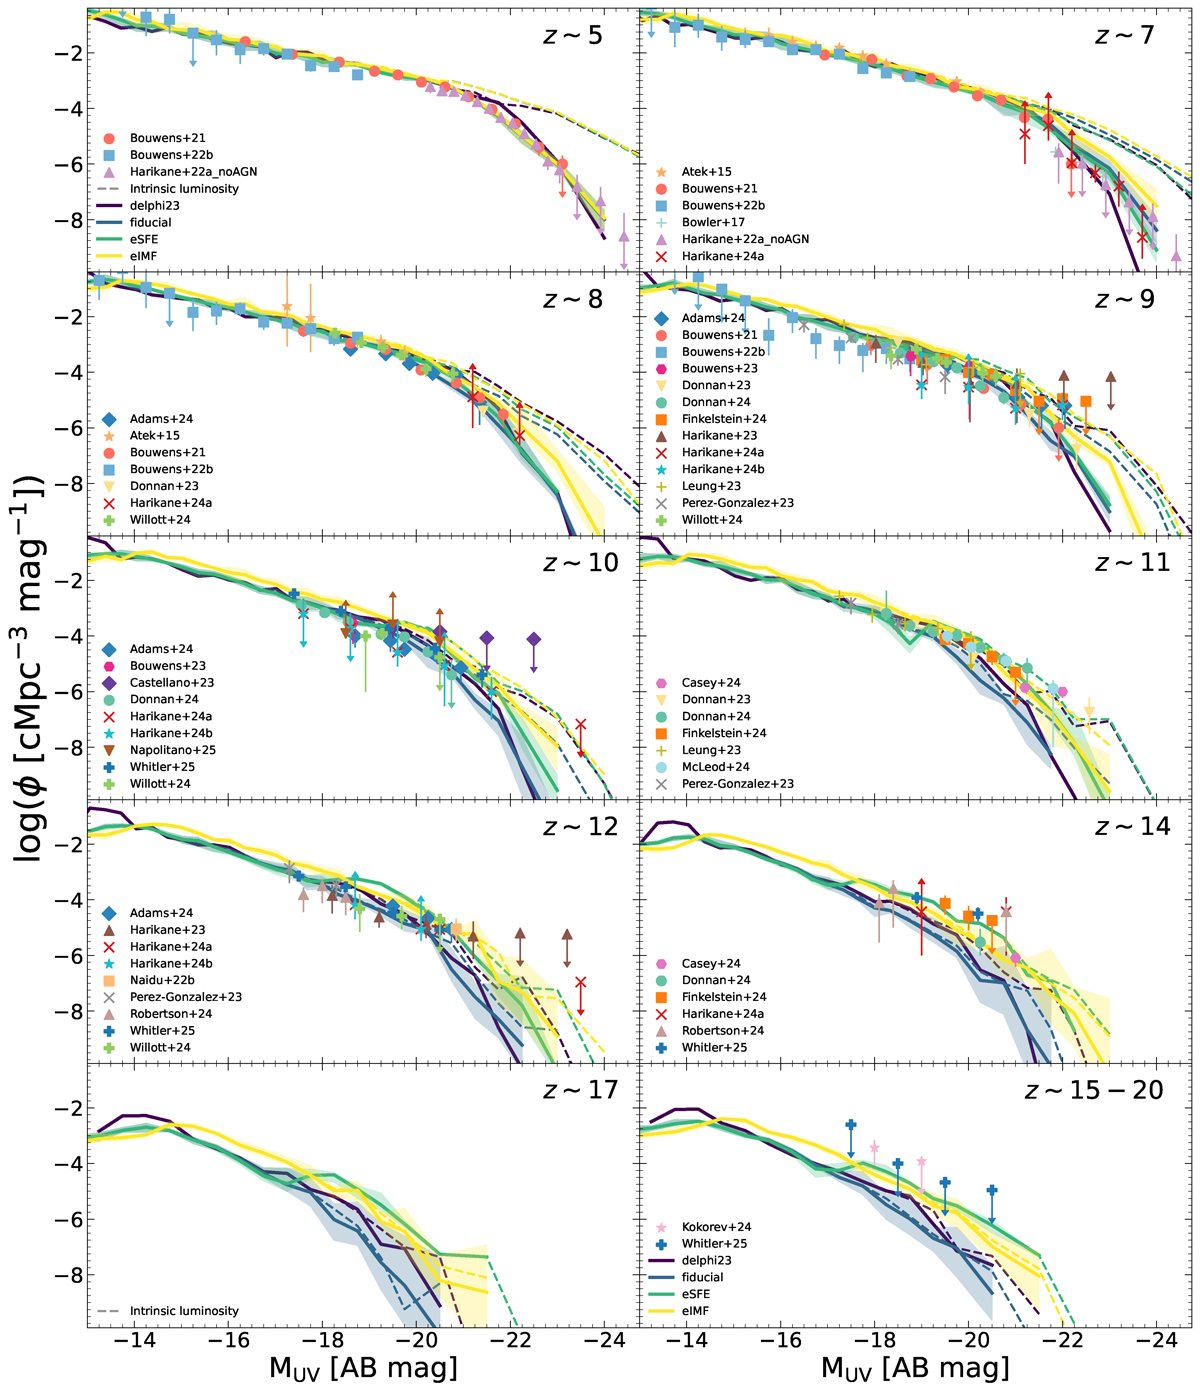
Download original image
Redshift evolution of the UV LF between z ∼ 5 − 20, as marked. In each panel, we show a comparison of the fiducial model, and the eIMF and eSFE models against the results from DELPHI23 (Mauerhofer & Dayal 2023) for both the intrinsic (dashed lines) and dust attenuated (solid lines) UV LFs. These lines show the means of five runs sampling the PDFs for fcold and f* from SPHINX20. For the sake of clarity we only show the maximum and minimum values associated with these runs for the observed UV LFs through shaded areas. In each panel, as marked, points show observational data (from Adams et al. 2024; Atek et al. 2015, 2018; Bouwens et al. 2021, 2022b, 2023; Bowler et al. 2017; Casey et al. 2024; Castellano et al. 2023; Donnan et al. 2023, 2024; Finkelstein et al. 2024; Harikane et al. 2022, 2023, 2024, 2025; Ishigaki et al. 2018; Leung et al. 2023; McLeod et al. 2024; Naidu et al. 2022a; Napolitano et al. 2025; Pérez-González et al. 2023; Robertson et al. 2024; Willott et al. 2024; Whitler et al. 2025). The last panel shows the UV LF integrated between z ∼ 15 − 20 in order to compare with observations at those redshifts (Kokorev et al. 2024; Whitler et al. 2025).
Current usage metrics show cumulative count of Article Views (full-text article views including HTML views, PDF and ePub downloads, according to the available data) and Abstracts Views on Vision4Press platform.
Data correspond to usage on the plateform after 2015. The current usage metrics is available 48-96 hours after online publication and is updated daily on week days.
Initial download of the metrics may take a while.