Fig. 15.
Download original image
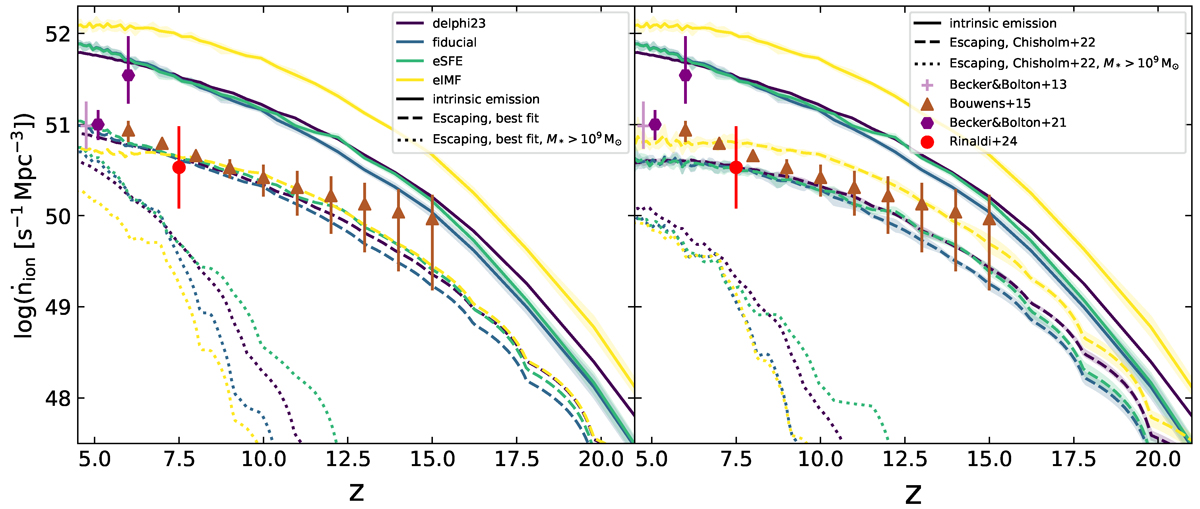
Evolution of the ionising photon rate density as a function of redshift. In both panels, for reference, the solid lines represent the intrinsic ionising photon density for the different models studied, as marked. Shaded regions highlight the spread from the minimum to maximum values among the five runs with different random seeds. The two panels show the ‘escaping’ emissivity for the two fesc models studied in this work for all galaxies (dashed lines) and those with M* > 109 M⊙ (dotted lines). The left panel shows results for a constant value of fesc needed to match reionisation constraints; the right panel shows results using fesc values from Chisholm et al. (2022) as shown in Eq. (9). In both panels, points show observational constraints (from Becker & Bolton 2013; Bouwens et al. 2015; Becker et al. 2021; Rinaldi et al. 2024).
Current usage metrics show cumulative count of Article Views (full-text article views including HTML views, PDF and ePub downloads, according to the available data) and Abstracts Views on Vision4Press platform.
Data correspond to usage on the plateform after 2015. The current usage metrics is available 48-96 hours after online publication and is updated daily on week days.
Initial download of the metrics may take a while.