Fig. 14.
Download original image
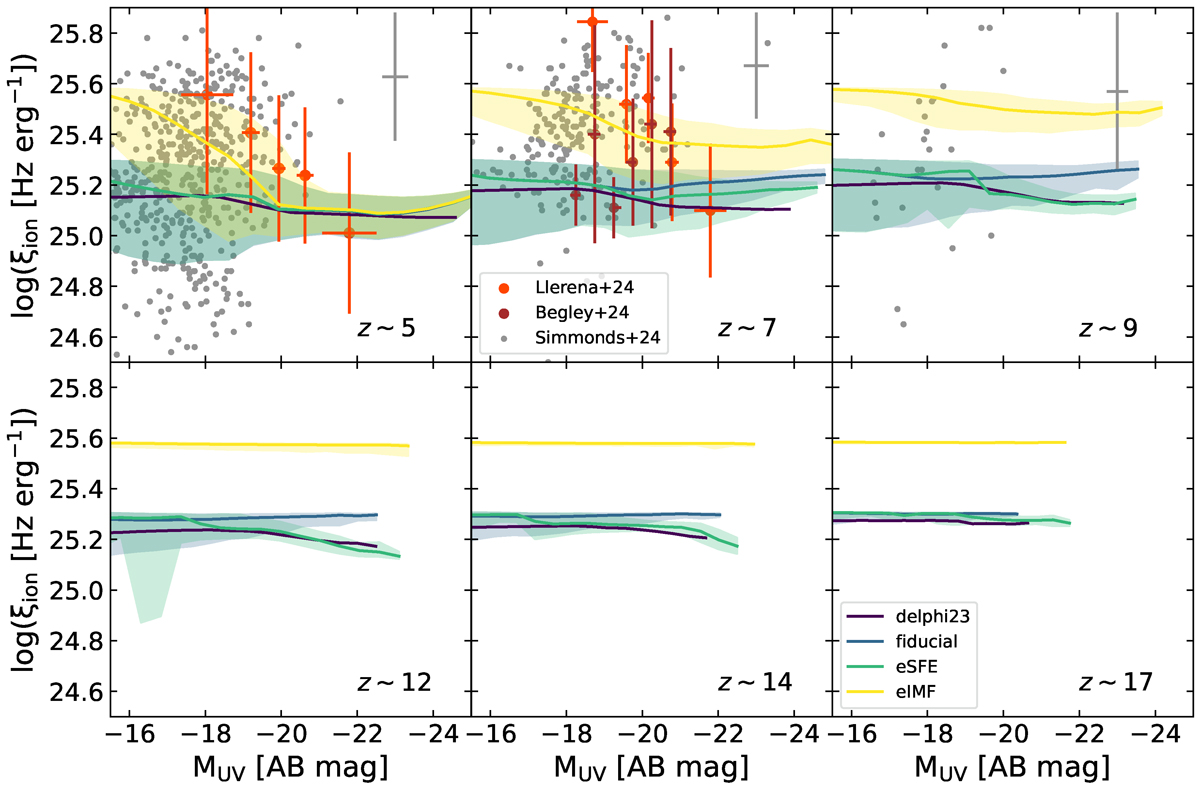
Ionising photon production efficiency (ξion) as a function of the observed UV magnitude. Lines represent the mean of the five runs with different seeds for each model; shaded areas represent the range between the minima and maxima shown by the 16th and 84th percentiles, respectively. Points show observational data as marked (from Simmonds et al. 2024; Llerena et al. 2024; Begley et al. 2025). The crosses at the top right corner of the upper panels indicate the average error on measured magnitudes and ξion as estimated by Simmonds et al. (2024).
Current usage metrics show cumulative count of Article Views (full-text article views including HTML views, PDF and ePub downloads, according to the available data) and Abstracts Views on Vision4Press platform.
Data correspond to usage on the plateform after 2015. The current usage metrics is available 48-96 hours after online publication and is updated daily on week days.
Initial download of the metrics may take a while.