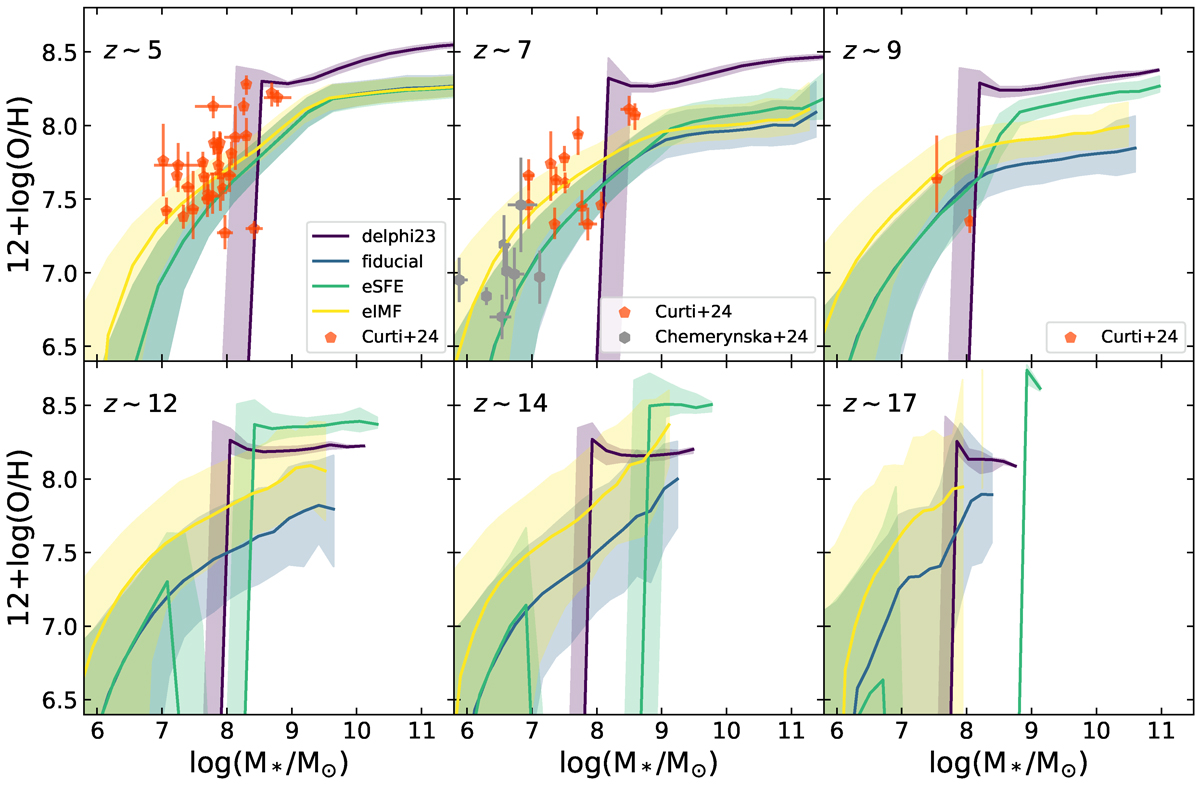
Fig. 11.
Download original image
Gas-phase metallicity as a function of stellar mass at z ∼ 5 − 17, as marked. Lines represent the mean of the five runs with different seeds for each model; shaded areas represent the range between the minima and maxima shown by the 16th and 84th percentiles, respectively. At z ∼ 5 − 9, orange pentagons show observational results from Curti et al. (2024). At z ∼ 7, grey hexagons show observations of the low-mass end of the mass-metallicity relation from Chemerynska et al. (2024).
Current usage metrics show cumulative count of Article Views (full-text article views including HTML views, PDF and ePub downloads, according to the available data) and Abstracts Views on Vision4Press platform.
Data correspond to usage on the plateform after 2015. The current usage metrics is available 48-96 hours after online publication and is updated daily on week days.
Initial download of the metrics may take a while.