Fig. 8.
Download original image
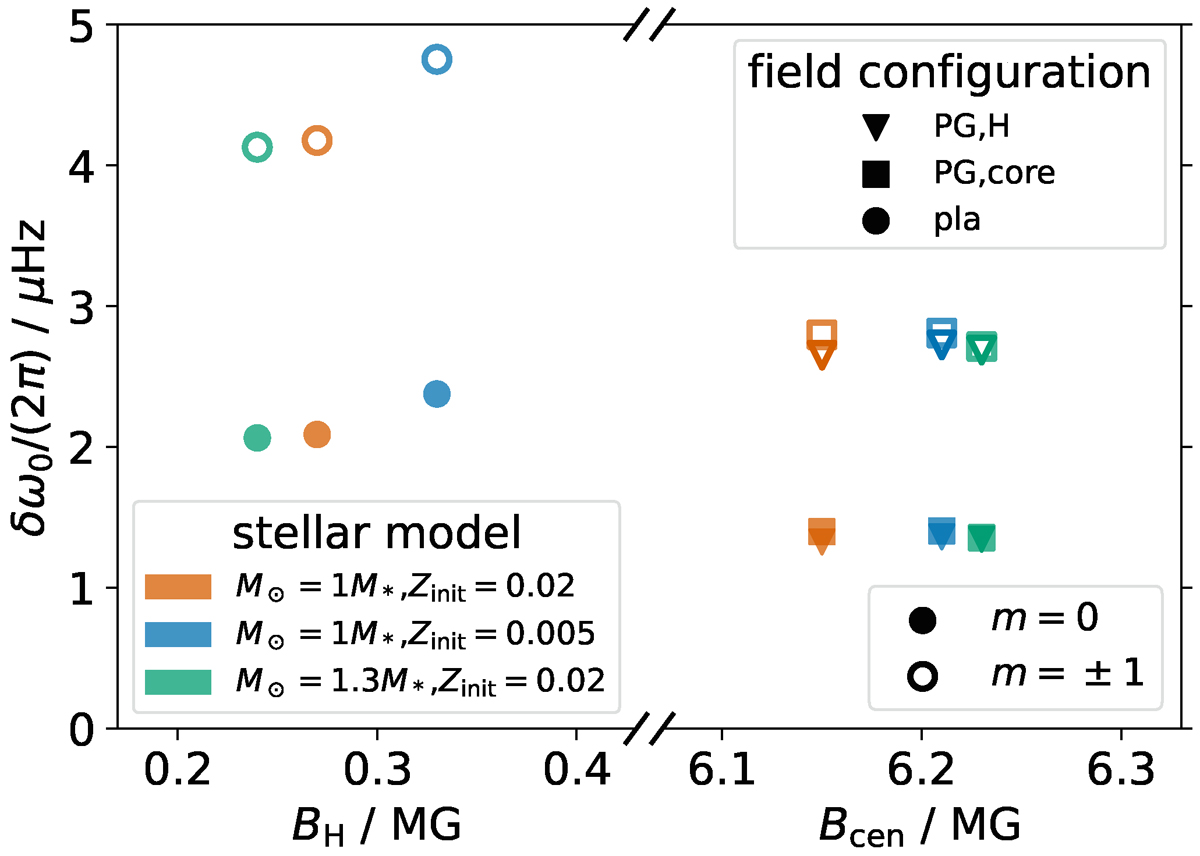
Average frequency shift of the dipole modes caused by various internal magnetic field configurations as a function of the magnetic field strength for three stellar models. The field strengths have been chosen such that Bcen = 0.7 Bcrit, cen and BH = 0.7 Bcrit, H. The critical field strengths were calculated at ω = 2πνmax with l = 1. Colors correspond to different stellar models and symbols indicate that a different magnetic field configuration has been used. Average frequency shifts corresponding to the azimuthal order m = 0 (m = ±1) are shown as solid symbols (outlines). The field configurations and the calculation of the average frequency shifts are described in Sect. 4.3 and in the notes under Table 3, which also summarizes the data shown in this figure. Note that the horizontal axis is broken.
Current usage metrics show cumulative count of Article Views (full-text article views including HTML views, PDF and ePub downloads, according to the available data) and Abstracts Views on Vision4Press platform.
Data correspond to usage on the plateform after 2015. The current usage metrics is available 48-96 hours after online publication and is updated daily on week days.
Initial download of the metrics may take a while.