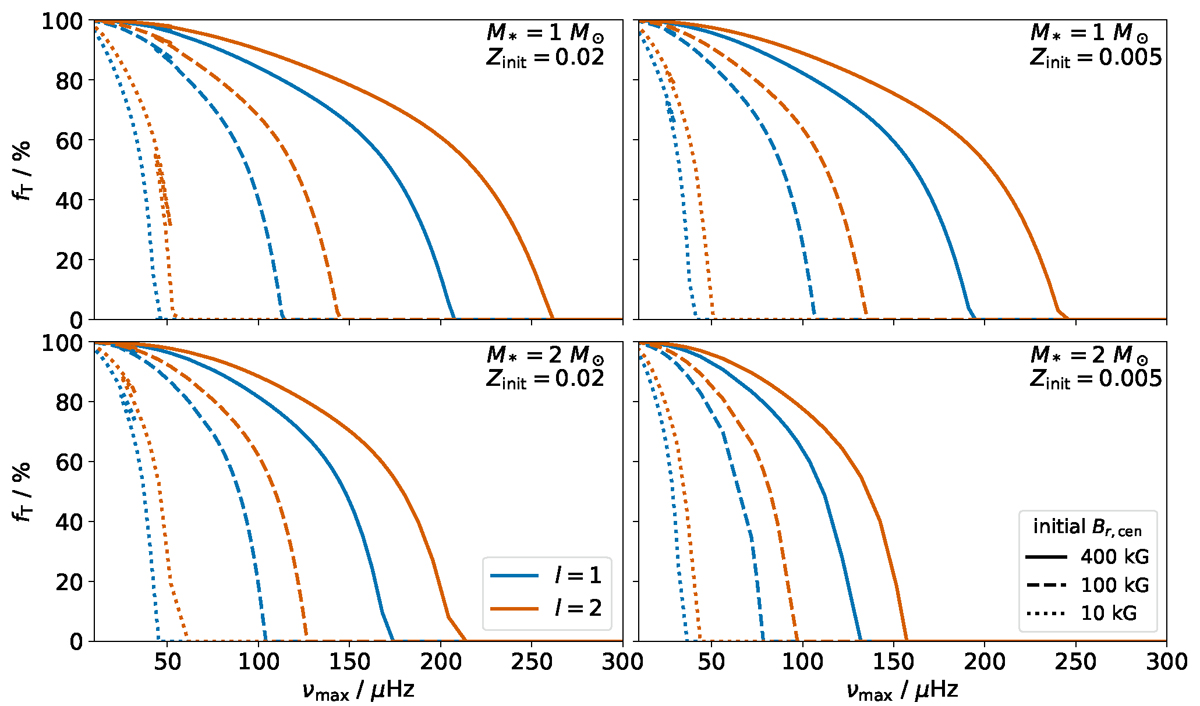
Fig. 6.
Download original image
Trapped fraction evaluated with Eq. (13) at ω = 2πνmax, where νmax is the frequency of maximum oscillation power, as a function of the evolution of the star indicated by νmax (stars evolve from right to left). Each panel features one of the four evolutionary tracks presented in Fig. 1. Rows show tracks with the same stellar mass and columns show tracks with the same metallicity. The blue (red) lines correspond to the dipole (quadrupole) modes. Different linestyles (solid, dashed, dotted) represent different initial strengths of the radial component of the magnetic field at the stellar center, which corresponds to the field strength the end of the MS. Due to the conservation of magnetic flux, the magnetic field strength increases as the stars evolve. The small knees that occur at the points where fT becomes greater than 0, which are visible in some of the curves, are caused by the limited temporal resolution of the evolutionary tracks. We show the evolution of the trapped fraction considering BH/Bcrit, H instead of Bcen/Bcrit, cen in Fig. B.4.
Current usage metrics show cumulative count of Article Views (full-text article views including HTML views, PDF and ePub downloads, according to the available data) and Abstracts Views on Vision4Press platform.
Data correspond to usage on the plateform after 2015. The current usage metrics is available 48-96 hours after online publication and is updated daily on week days.
Initial download of the metrics may take a while.