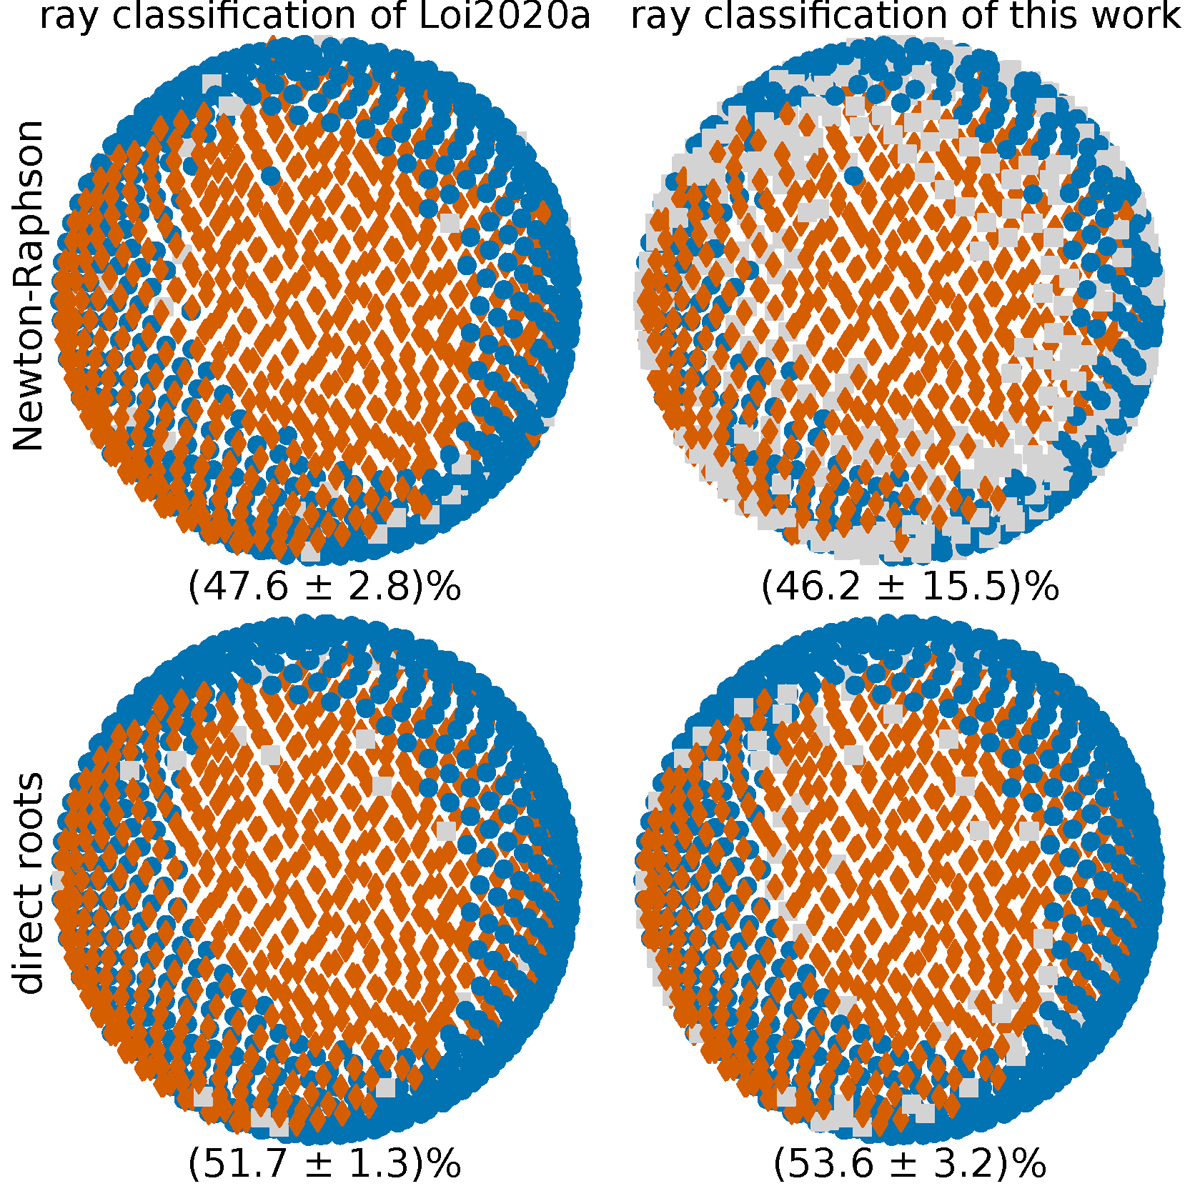
Fig. A.2.
Download original image
Sets of 1200 rays plotted as as unispheres parameterized by (θ, ϕ) = (θ0, α) for the model 2A with Bcen = Bcrit, cen, ω = 10 ωdyn, and l = 1. Trapped rays are shown as blue dots, reflected rays are shown as red diamonds, and unclassified rays are shown as gray squares. In the top row, we show rays for which we have used a Newton-Raphson iteration scheme for the correction of kr, which was used by Loi (2020a). In the bottom row, we show rays where we have used our method described in Sect. 2.4 to correct kr. In the left column, we employed the ray classification scheme of Loi (2020a) to decide whether a ray is trapped, reflected, or unclassified. In the right column, we used our ray classification scheme described in Appendix A.4. The trapped fraction fT of each set is indicated under its corresponding unisphere.
Current usage metrics show cumulative count of Article Views (full-text article views including HTML views, PDF and ePub downloads, according to the available data) and Abstracts Views on Vision4Press platform.
Data correspond to usage on the plateform after 2015. The current usage metrics is available 48-96 hours after online publication and is updated daily on week days.
Initial download of the metrics may take a while.