Fig. 1.
Download original image
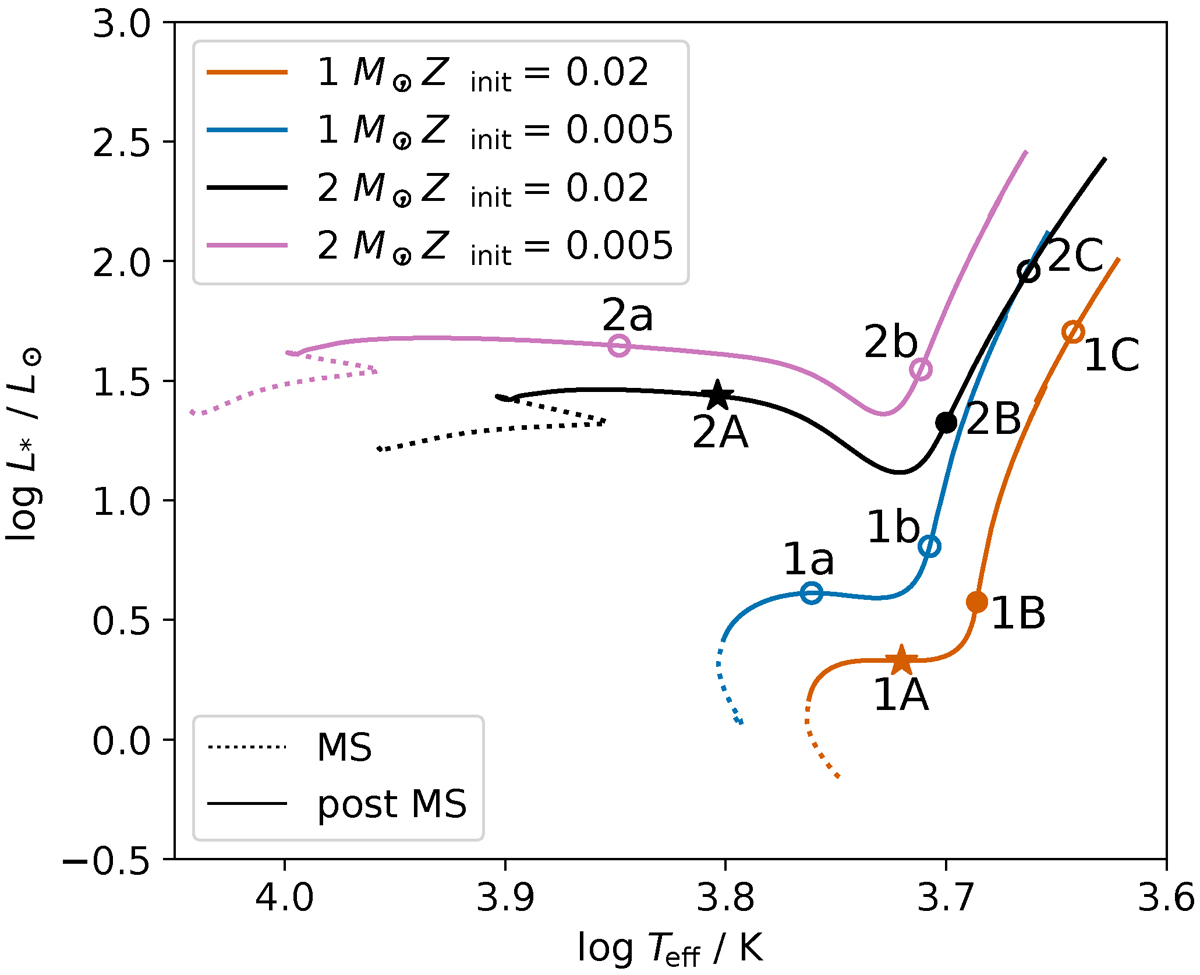
Hertzsprung-Russell diagram of the four evolutionary tracks with different stellar masses and metallicities described in Sect. 2. The evolution of the MS is shown as a dotted line and the evolution after the MS as a solid line. We do not show the full evolution after the MS. The locations of the stellar models that served as the background for the ray tracing analysis are indicated by the various symbols. Star symbols indicate that the central field strength Bcen, the frequency ω, and the spherical degree l were varied during the ray tracing analysis of a particular model. Full dots indicate that Bcen and ω were varied and circles indicate that only Bcen was varied.
Current usage metrics show cumulative count of Article Views (full-text article views including HTML views, PDF and ePub downloads, according to the available data) and Abstracts Views on Vision4Press platform.
Data correspond to usage on the plateform after 2015. The current usage metrics is available 48-96 hours after online publication and is updated daily on week days.
Initial download of the metrics may take a while.