Fig. 3.
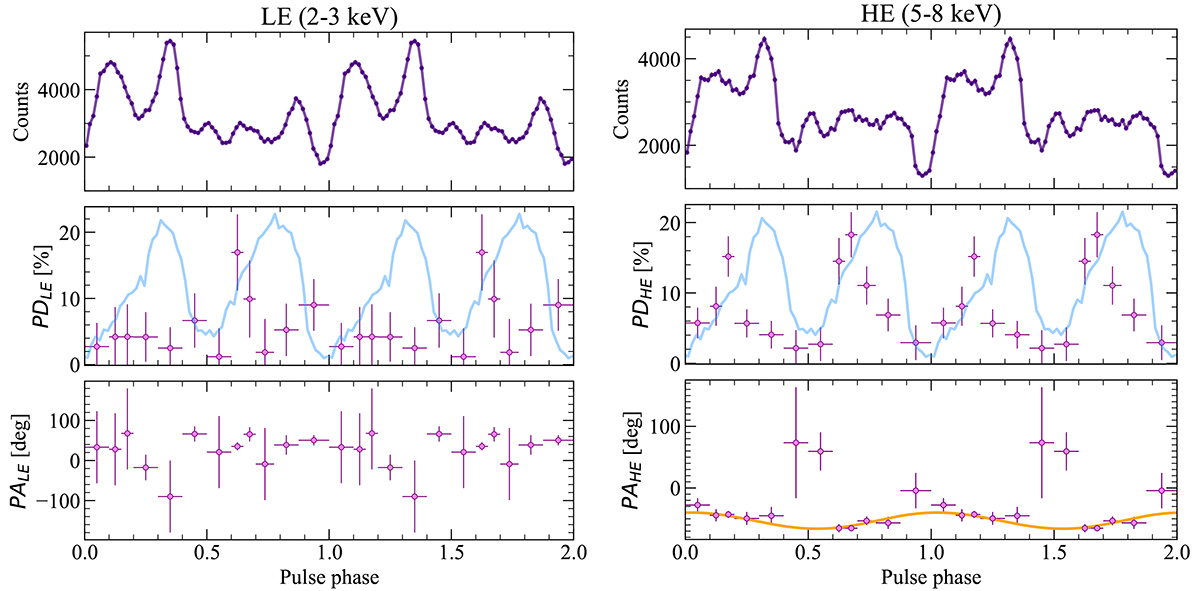
Download original image
Results of the phase-resolved spectro-polarimetric analysis of Vela X-1 based on the IXPE data at low energies (LE; 2−3 keV; left) and high energies (HE; 5−8 keV; right). Top panels: Pulse profiles (in counts) corresponding to the low- and high-energy ranges. Middle and bottom panels: Pulse-phase dependence of the PD and PA, respectively. The NuSTAR pulse profile in the 15−45 keV energy band is displayed in the PD panels (light blue). The orange curve in the PA panel shows the best-fit RVM to the data in the high-energy range.
Current usage metrics show cumulative count of Article Views (full-text article views including HTML views, PDF and ePub downloads, according to the available data) and Abstracts Views on Vision4Press platform.
Data correspond to usage on the plateform after 2015. The current usage metrics is available 48-96 hours after online publication and is updated daily on week days.
Initial download of the metrics may take a while.