Fig. A.1
Download original image
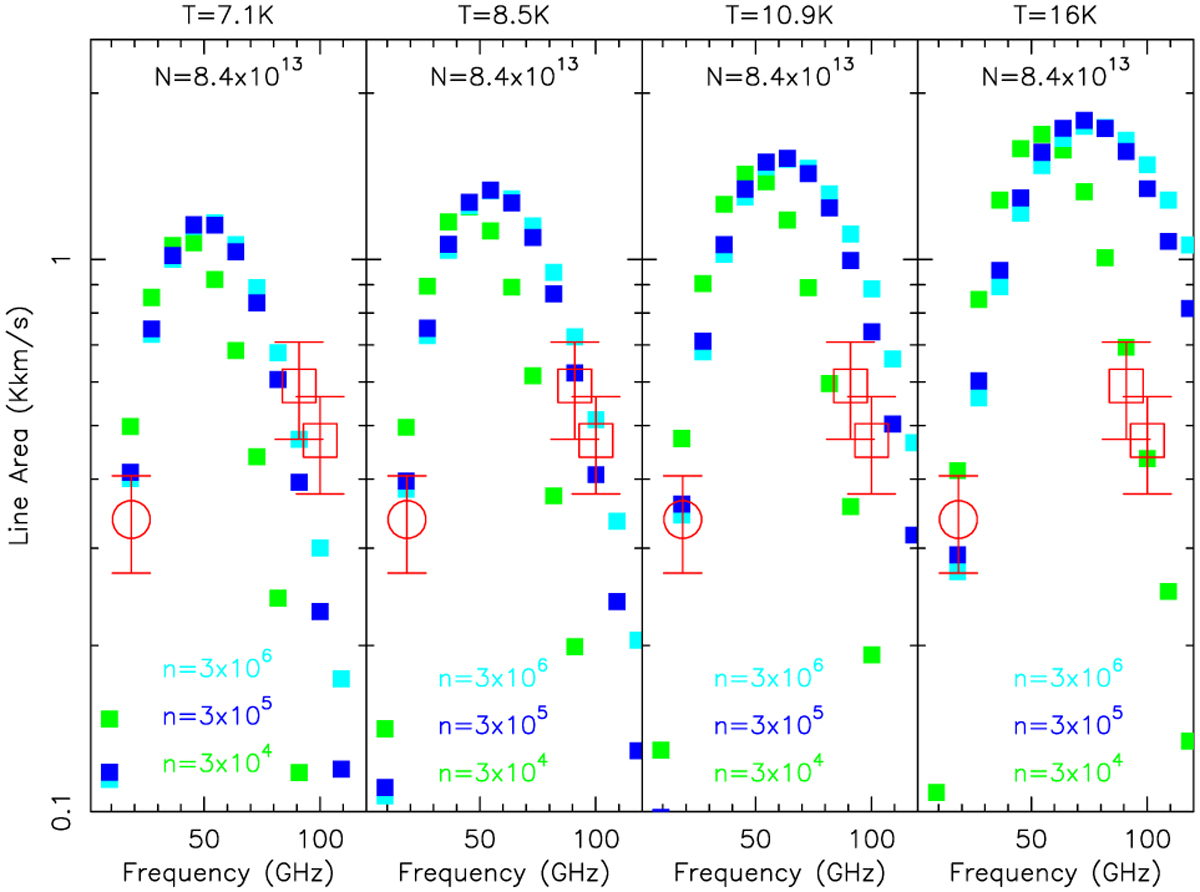
Large velocity gradient models of the HC3N emission in Cha- MMS1 for different densities (filled cyan, blue, and green squares, as labeled). The four panels correspond to kinetic temperatures of 7.1, 8.5, 10.9, and 16 K, left to right, respectively. The open red circle shows our DSN observation while the red squares are SEST observations of Kon-tinen et al. (2000). The error bars correspond to a typical 20% absolute calibration uncertainty.
Current usage metrics show cumulative count of Article Views (full-text article views including HTML views, PDF and ePub downloads, according to the available data) and Abstracts Views on Vision4Press platform.
Data correspond to usage on the plateform after 2015. The current usage metrics is available 48-96 hours after online publication and is updated daily on week days.
Initial download of the metrics may take a while.