Fig. 6
Download original image
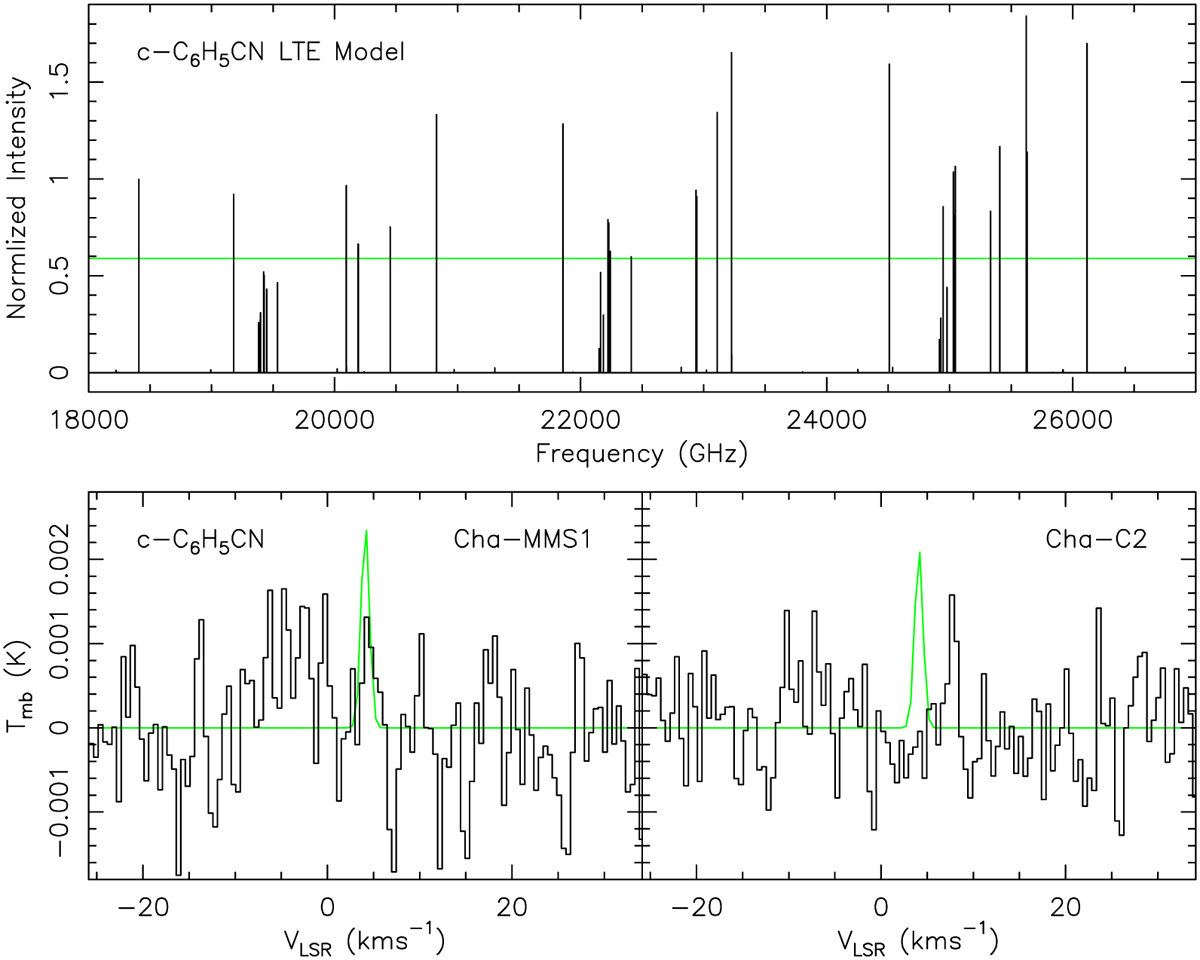
Top: local thermodynamic equilibrium model spectrum of benzonitrile in the DSS-43 frequency range for a temperature of 8.5 K. Line intensities are normalized to the 18.41 GHz transitions. Transitions above the green horizontal lines are included in the stacking analysis. Bottom: stacked spectra of benzonitrile toward Cha-MMS1 and Cha-C2 normalized to the 18.41 GHz line. The green curves are 3σ upper limit LTE models corresponding to column densities reported in Table 4.
Current usage metrics show cumulative count of Article Views (full-text article views including HTML views, PDF and ePub downloads, according to the available data) and Abstracts Views on Vision4Press platform.
Data correspond to usage on the plateform after 2015. The current usage metrics is available 48-96 hours after online publication and is updated daily on week days.
Initial download of the metrics may take a while.