Fig. 2
Download original image
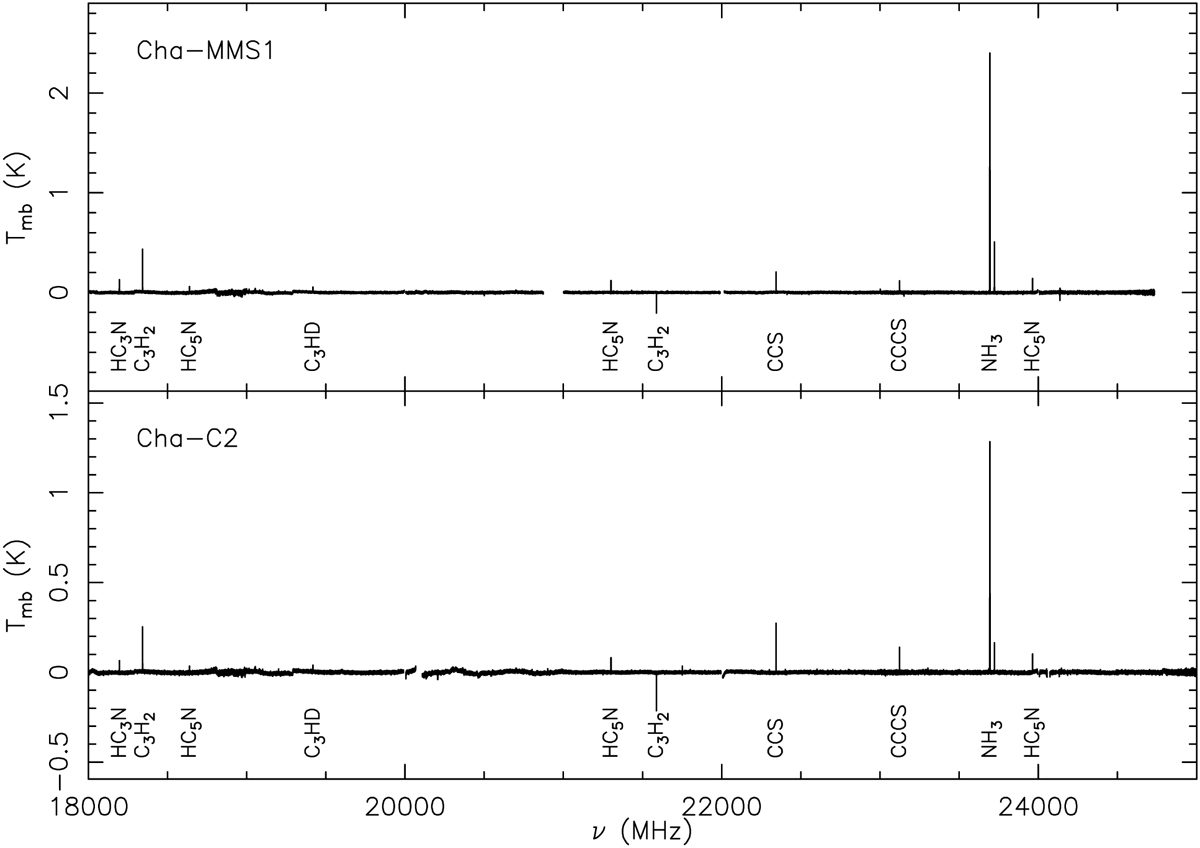
Deep Space Network spectra of Cha MMS1 and Cha C2 (upper and lower panels, respectively) corrected for the main beam efficiency. Channels with excess noise near sub-band edges and spurious signals have been blanked, resulting in some gaps in the frequency coverage. Detected spectral lines are identified (see Tables 1 and 2).
Current usage metrics show cumulative count of Article Views (full-text article views including HTML views, PDF and ePub downloads, according to the available data) and Abstracts Views on Vision4Press platform.
Data correspond to usage on the plateform after 2015. The current usage metrics is available 48-96 hours after online publication and is updated daily on week days.
Initial download of the metrics may take a while.