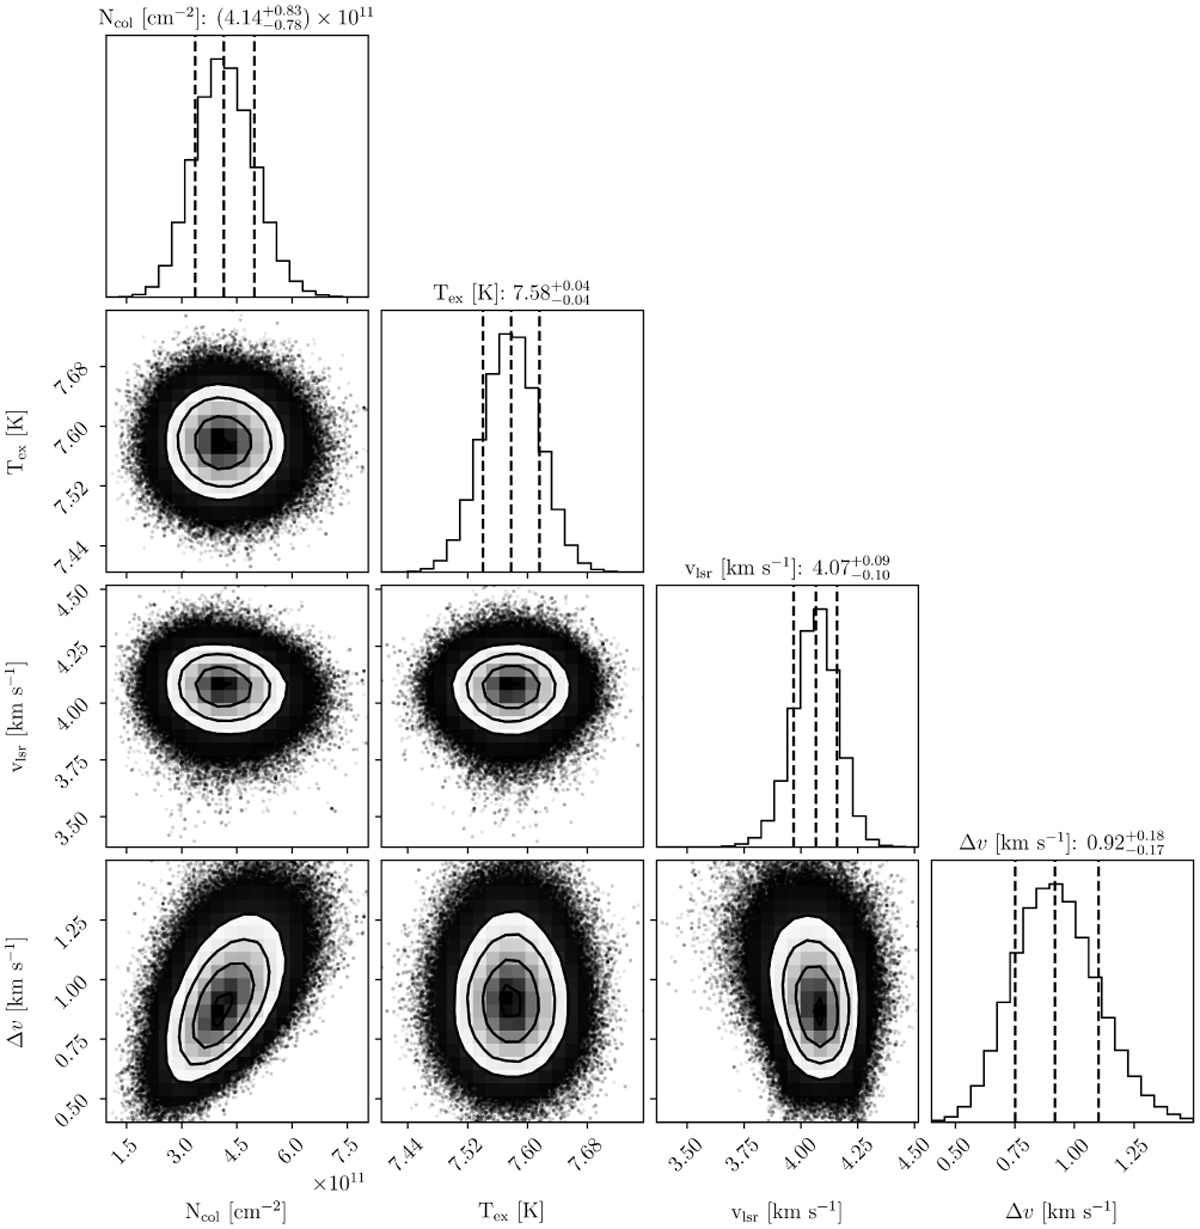
Fig. C.1
Download original image
Corner plot for the MCMC fit ofHC7N parameter covariances and distributions in the Cha-MMS1. The diagonal shows the probability distributions of each parameter as histograms, with vertical lines marking the 16th, 50th, and 84th percentiles, corresponding to ±1σ for a Gaussian posterior. The off-diagonal scatter plots depict the correlations between pairs of parameters, with each axis representing one of the fit parameters. The beam-averaged best-fit column density is consistent with the Weeds pencil beam value listed in Table 4.
Current usage metrics show cumulative count of Article Views (full-text article views including HTML views, PDF and ePub downloads, according to the available data) and Abstracts Views on Vision4Press platform.
Data correspond to usage on the plateform after 2015. The current usage metrics is available 48-96 hours after online publication and is updated daily on week days.
Initial download of the metrics may take a while.