Fig. 4
Download original image
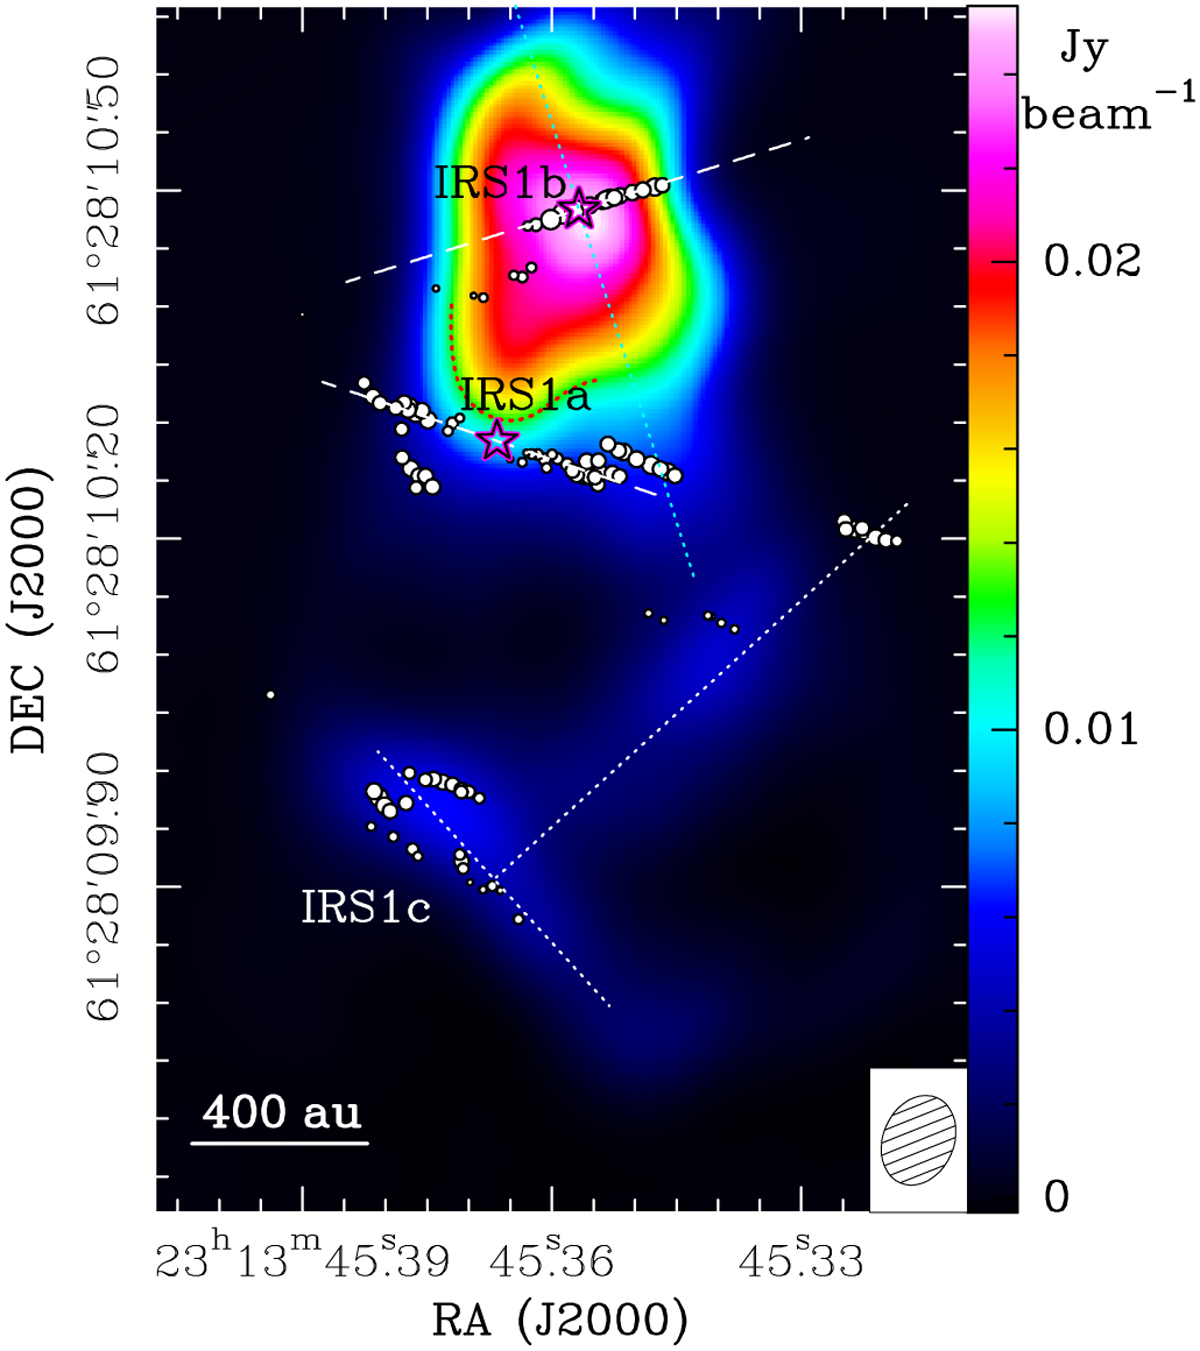
Structure of the HC HII region. The color map shows the image of the 1.3 cm continuum observed with the JVLA A-Array in June 2015, produced with Briggs weighting (robust 0). The beam of the 1.3 cm image is reported in the inset in the bottom right of the panel. The edge of the southern tip of the ionized core is marked with a dotted red curve. The dots, the two dashed lines, and the labeled stars have the same meaning as in Fig. 1. The dotted cyan and white lines draw the approximate axes of three elongated emissions discussed in the text.
Current usage metrics show cumulative count of Article Views (full-text article views including HTML views, PDF and ePub downloads, according to the available data) and Abstracts Views on Vision4Press platform.
Data correspond to usage on the plateform after 2015. The current usage metrics is available 48-96 hours after online publication and is updated daily on week days.
Initial download of the metrics may take a while.