Fig. 3
Download original image
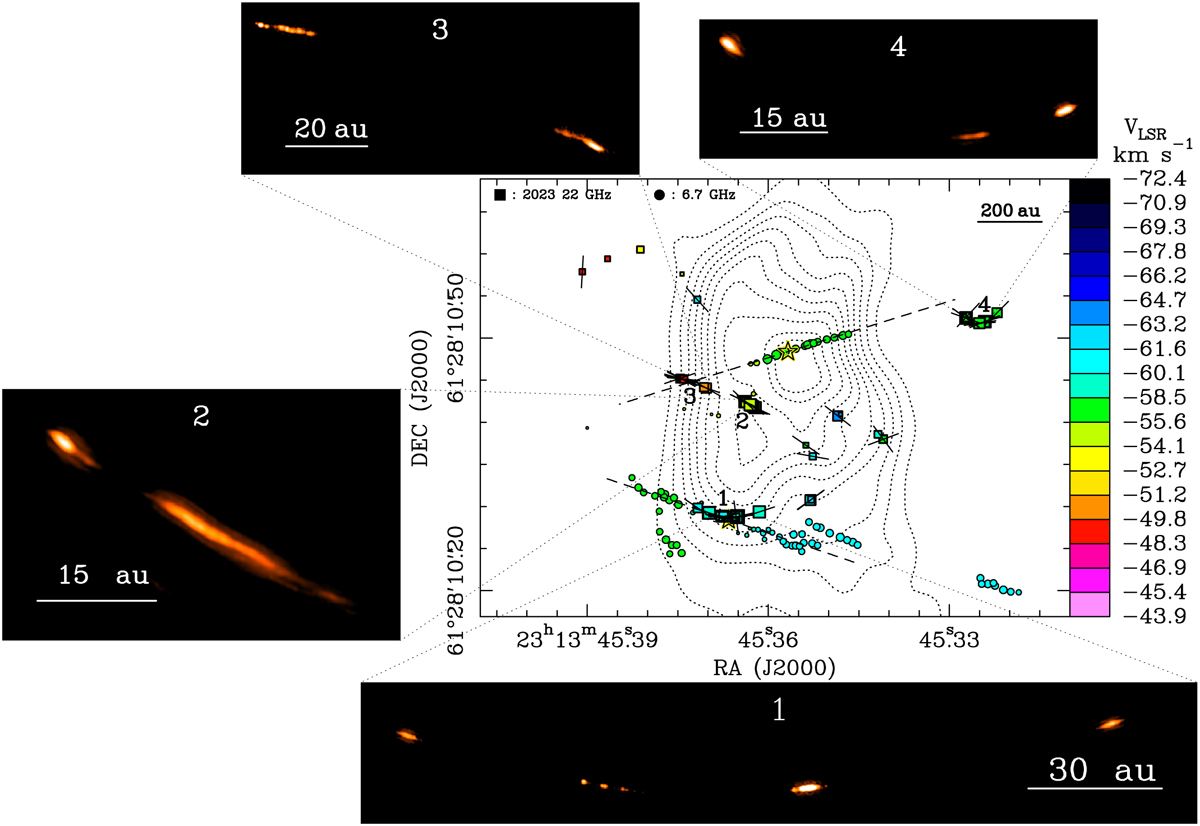
Structure of the water maser emission. Colored dots and the two dashed lines and black-yellow stars have the same meaning as in Fig. 1. Colored squares, black segments overlaid on the squares, and dotted contours have the same meaning as in Fig. 2. The emission of the water maser clusters 1–4 is shown in the corresponding insets. To catch weaker maser features, plots of the maximum emission over the cluster velocity range are presented. The beam of the global VLBI observations has a FWHM size of 0.6 au and it is too small to be shown in the insets.
Current usage metrics show cumulative count of Article Views (full-text article views including HTML views, PDF and ePub downloads, according to the available data) and Abstracts Views on Vision4Press platform.
Data correspond to usage on the plateform after 2015. The current usage metrics is available 48-96 hours after online publication and is updated daily on week days.
Initial download of the metrics may take a while.