Fig. 2
Download original image
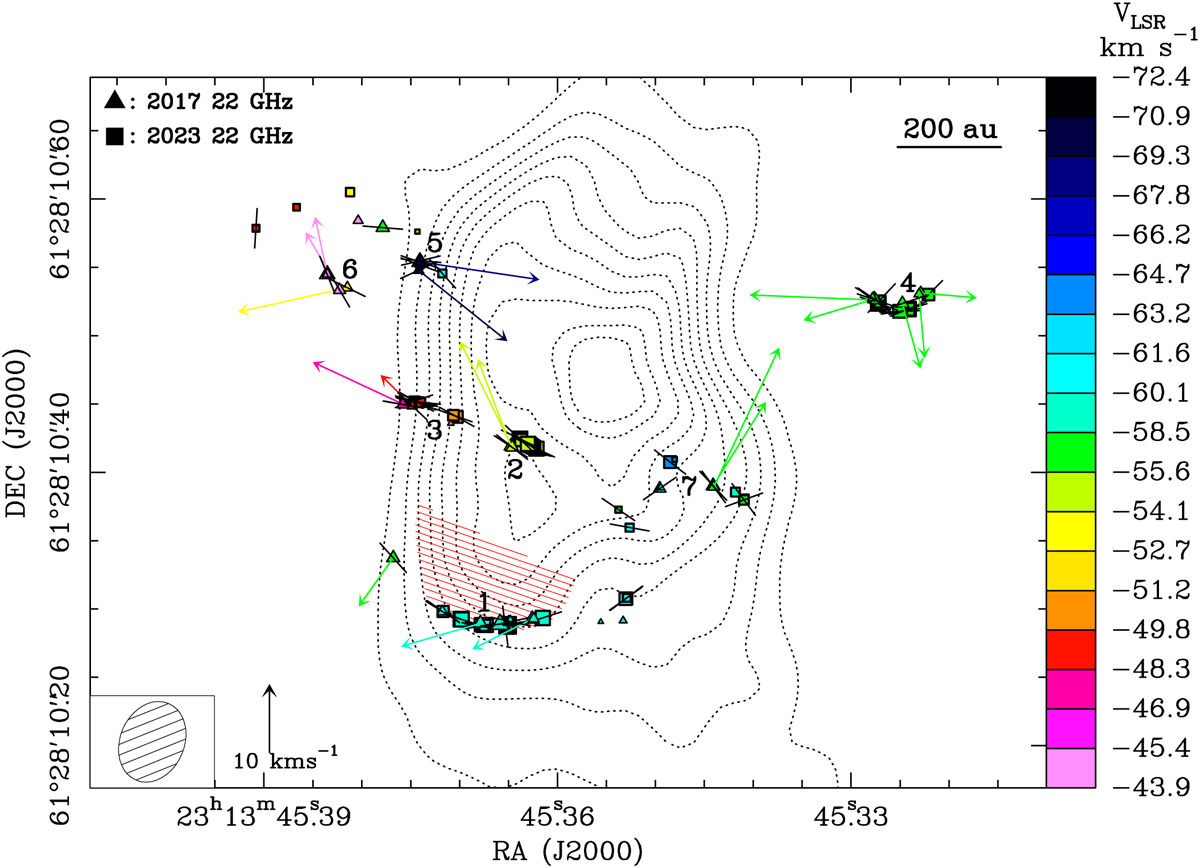
H2O masers (VLBA and global array) overlaid on the uniformly weighted image of the 1.3 cm continuum observed with the JVLA A-Array in June 2015. The absolute positions (relative to the epoch March 2, 2017) are reported with colored triangles and squares for the water masers from VLBA and global array observations, respectively. Colors denote the maser VLSR, and the symbol area is proportional to the logarithm of the maser intensity. Colored arrows represent the absolute proper motions of the water masers measured through the four VLBA epochs, with the velocity scale shown in the bottom left of the panel. Only the proper motions with more accurate directions are plotted. Black segments overlaid on the water masers indicate the PA of the maser features. The main water maser clusters are labeled from 1 to 7. The 1.3 cm map (dotted contours) was produced using archival data (JVLA proposal ID: 15A-115, see Sect. 3.2) originally reported by Beuther et al. (2017). Plotted contours are 10% to 90% (in steps of 10%), and 95% of the map peak equal to 0.015 Jy beam−1. The southern tip of the ionized core, edged by the arc-like maser cluster 1, is hatched in red. The beam of the 1.3 cm image is reported in the inset in the bottom left of the panel.
Current usage metrics show cumulative count of Article Views (full-text article views including HTML views, PDF and ePub downloads, according to the available data) and Abstracts Views on Vision4Press platform.
Data correspond to usage on the plateform after 2015. The current usage metrics is available 48-96 hours after online publication and is updated daily on week days.
Initial download of the metrics may take a while.