Fig. 7.
Download original image
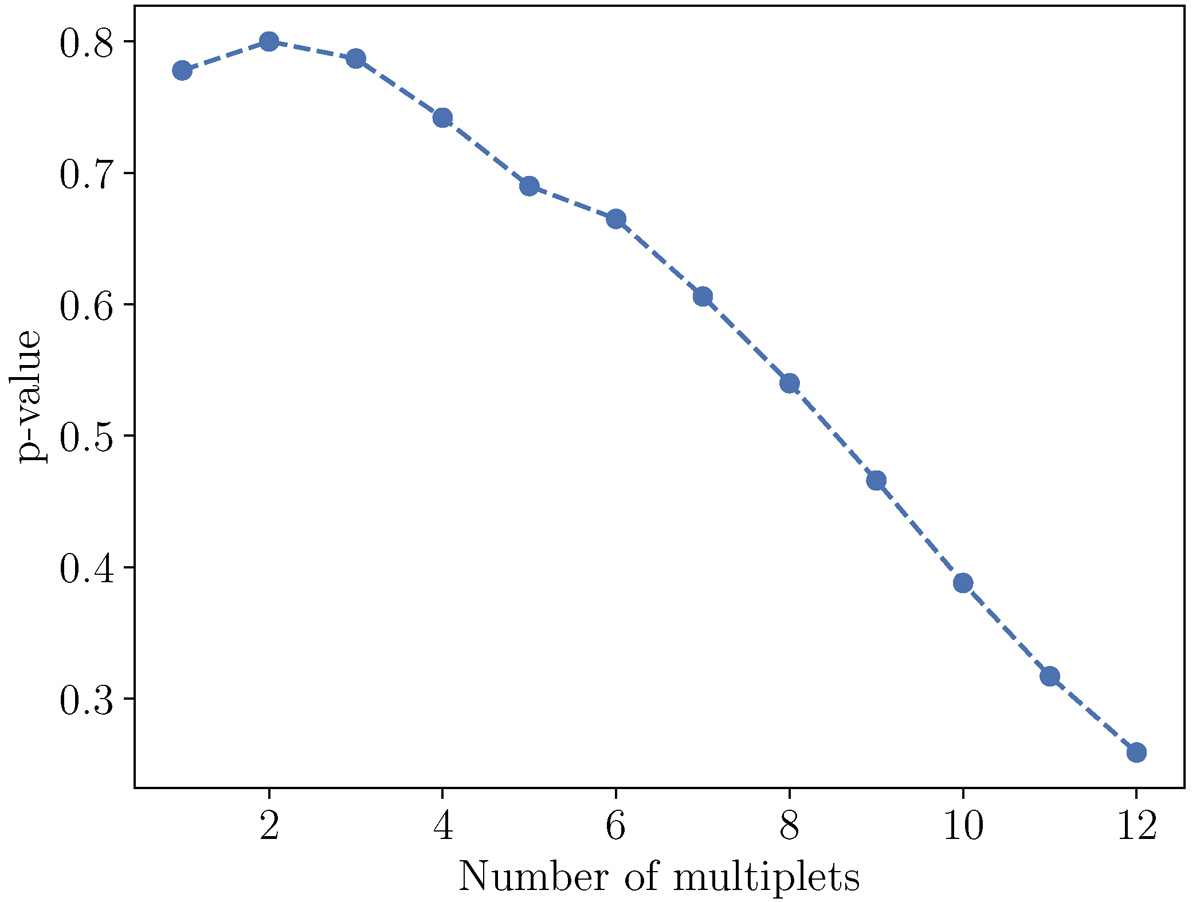
P values when considering the top-ranked number of multiplets for an area threshold of A ≤ 6.27 deg2. The x-axis shows how many multiplets contribute to the p value (sorted by highest test statistic value), and the y-axis shows the p value. In this case, adding multiplets (by summing the test statistic values) lowers the chance probability, and we get the best p value of 26% when considering all multiplets.
Current usage metrics show cumulative count of Article Views (full-text article views including HTML views, PDF and ePub downloads, according to the available data) and Abstracts Views on Vision4Press platform.
Data correspond to usage on the plateform after 2015. The current usage metrics is available 48-96 hours after online publication and is updated daily on week days.
Initial download of the metrics may take a while.