Fig. 6.
Download original image
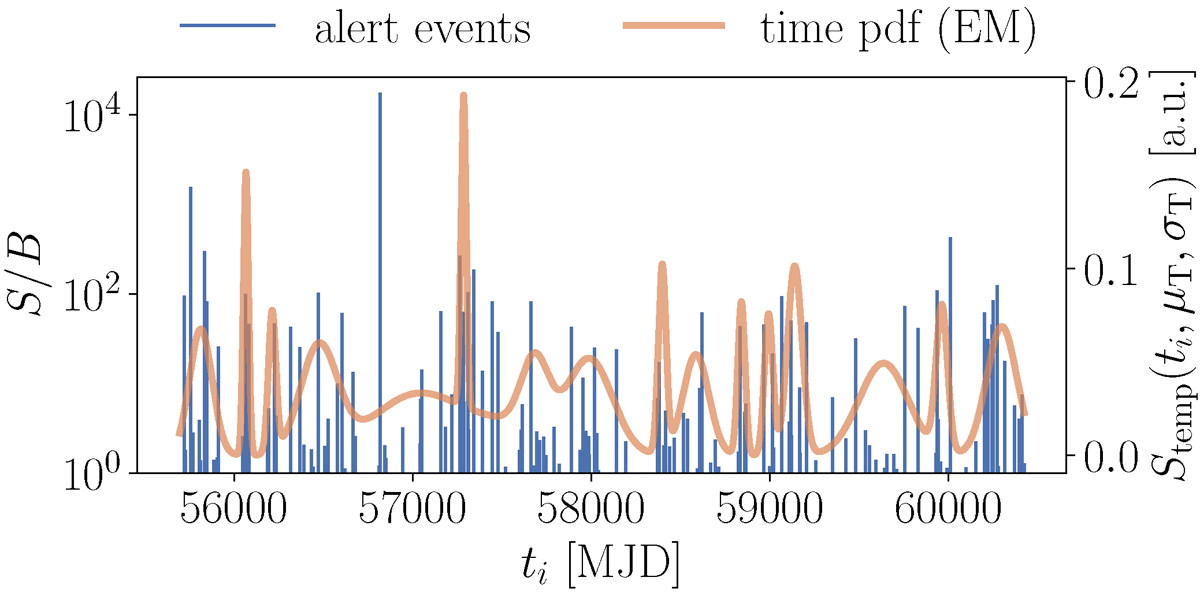
Example of a fitted time series. The left y-axis shows the applied weights for each event (Signal over Background: S/B). The x-axis shows the time range in MJD and the vertical blue lines indicate the detection times of the alert events. The orange line shows the best fit temporal signal probability density function, Stemp, consisting of the sum of k Gaussians, as determined with EM in arbitrary units. The height of each Gaussian is scaled with the number of associated events, nS, k. Stemp can reach greater values where many nS, k contribute, compared to times where a single event has a high S/B value without any close events in time.
Current usage metrics show cumulative count of Article Views (full-text article views including HTML views, PDF and ePub downloads, according to the available data) and Abstracts Views on Vision4Press platform.
Data correspond to usage on the plateform after 2015. The current usage metrics is available 48-96 hours after online publication and is updated daily on week days.
Initial download of the metrics may take a while.