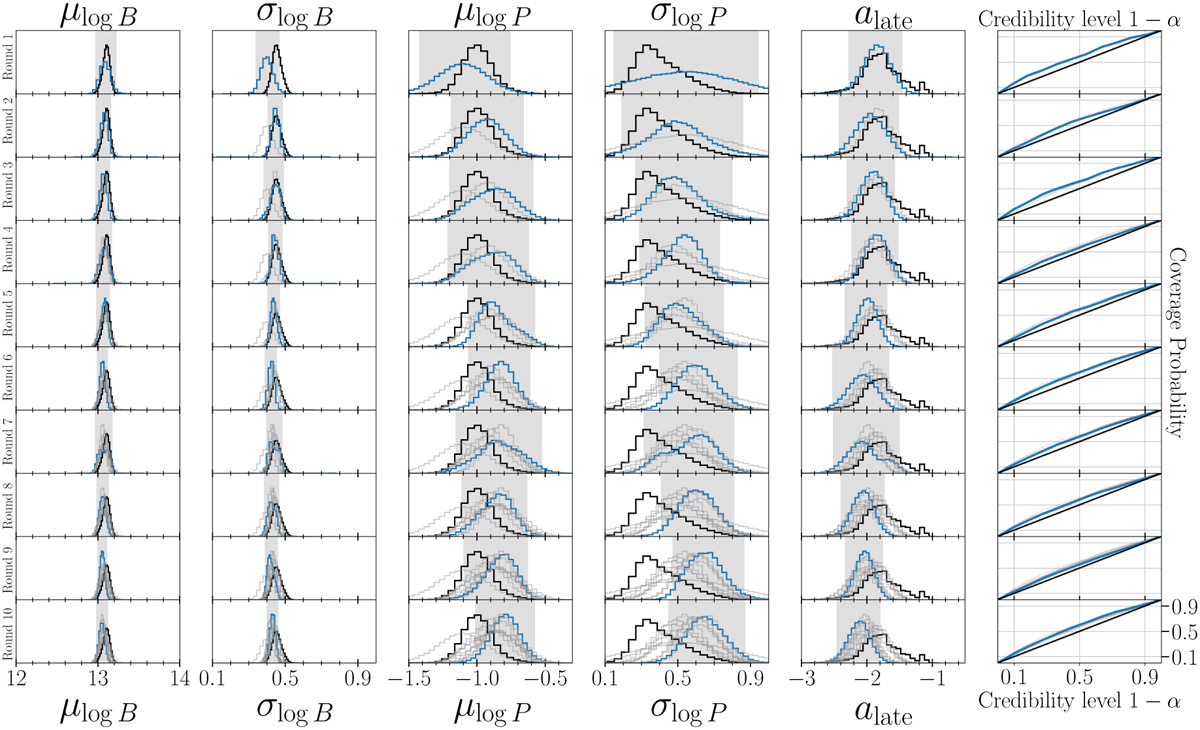
Fig. A.1
Download original image
Illustration of the TSNPE algorithm applied to our pulsar population synthesis. Here, we show results for inferring the five magneto- rotational parameters (as for Paper I) of the observed neutron star population in Experiment 1 with 1000 simulations in round 1. Each row corresponds to one round of inference. The last column shows the coverage probability computed on the test dataset. In each panel, the current round’s computed values are shown in blue, while values from previous rounds are shown in light grey. The grey shaded area in the one-dimensional marginal posterior represents the 95% credibility interval of the approximated posterior for that round. In each of these 1D marginal posterior distributions, the horizontal axes represent the parameters’ prior ranges. For comparison, the posterior distribution estimated in Paper I is shown as black solid lines.
Current usage metrics show cumulative count of Article Views (full-text article views including HTML views, PDF and ePub downloads, according to the available data) and Abstracts Views on Vision4Press platform.
Data correspond to usage on the plateform after 2015. The current usage metrics is available 48-96 hours after online publication and is updated daily on week days.
Initial download of the metrics may take a while.