Fig. 5
Download original image
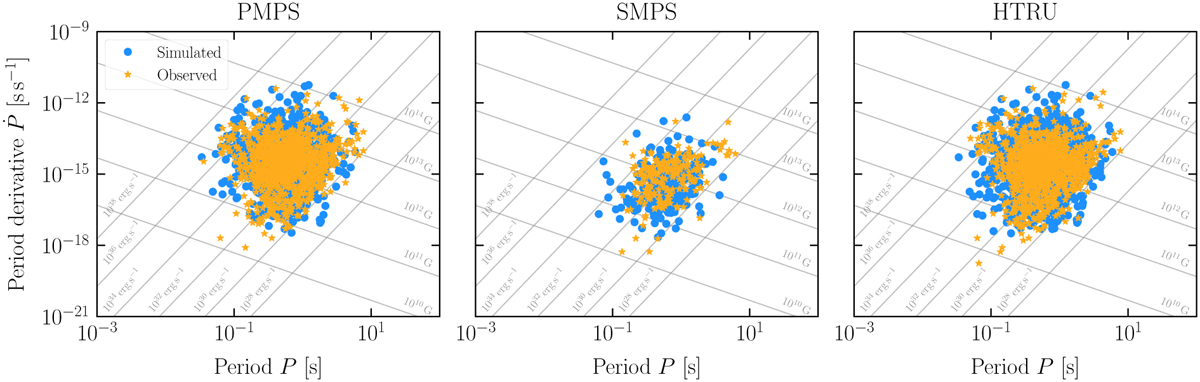
Simulated and observed populations of isolated Galactic radio pulsars. Each panel corresponds to a different survey, from left to right: PMPS, SMPS, and the low- and mid-latitude HTRU survey. The yellow stars indicate the observed pulsar population with data taken from the ATNF Pulsar Catalogue (Manchester et al. 2005, v2.5.1). The blue dots represent the simulated pulsar population for the parameters inferred via TSNPE (see Equation (19)). Lines of constant spin-down power (|Ėrot|) and constant dipolar surface magnetic field are also shown.
Current usage metrics show cumulative count of Article Views (full-text article views including HTML views, PDF and ePub downloads, according to the available data) and Abstracts Views on Vision4Press platform.
Data correspond to usage on the plateform after 2015. The current usage metrics is available 48-96 hours after online publication and is updated daily on week days.
Initial download of the metrics may take a while.