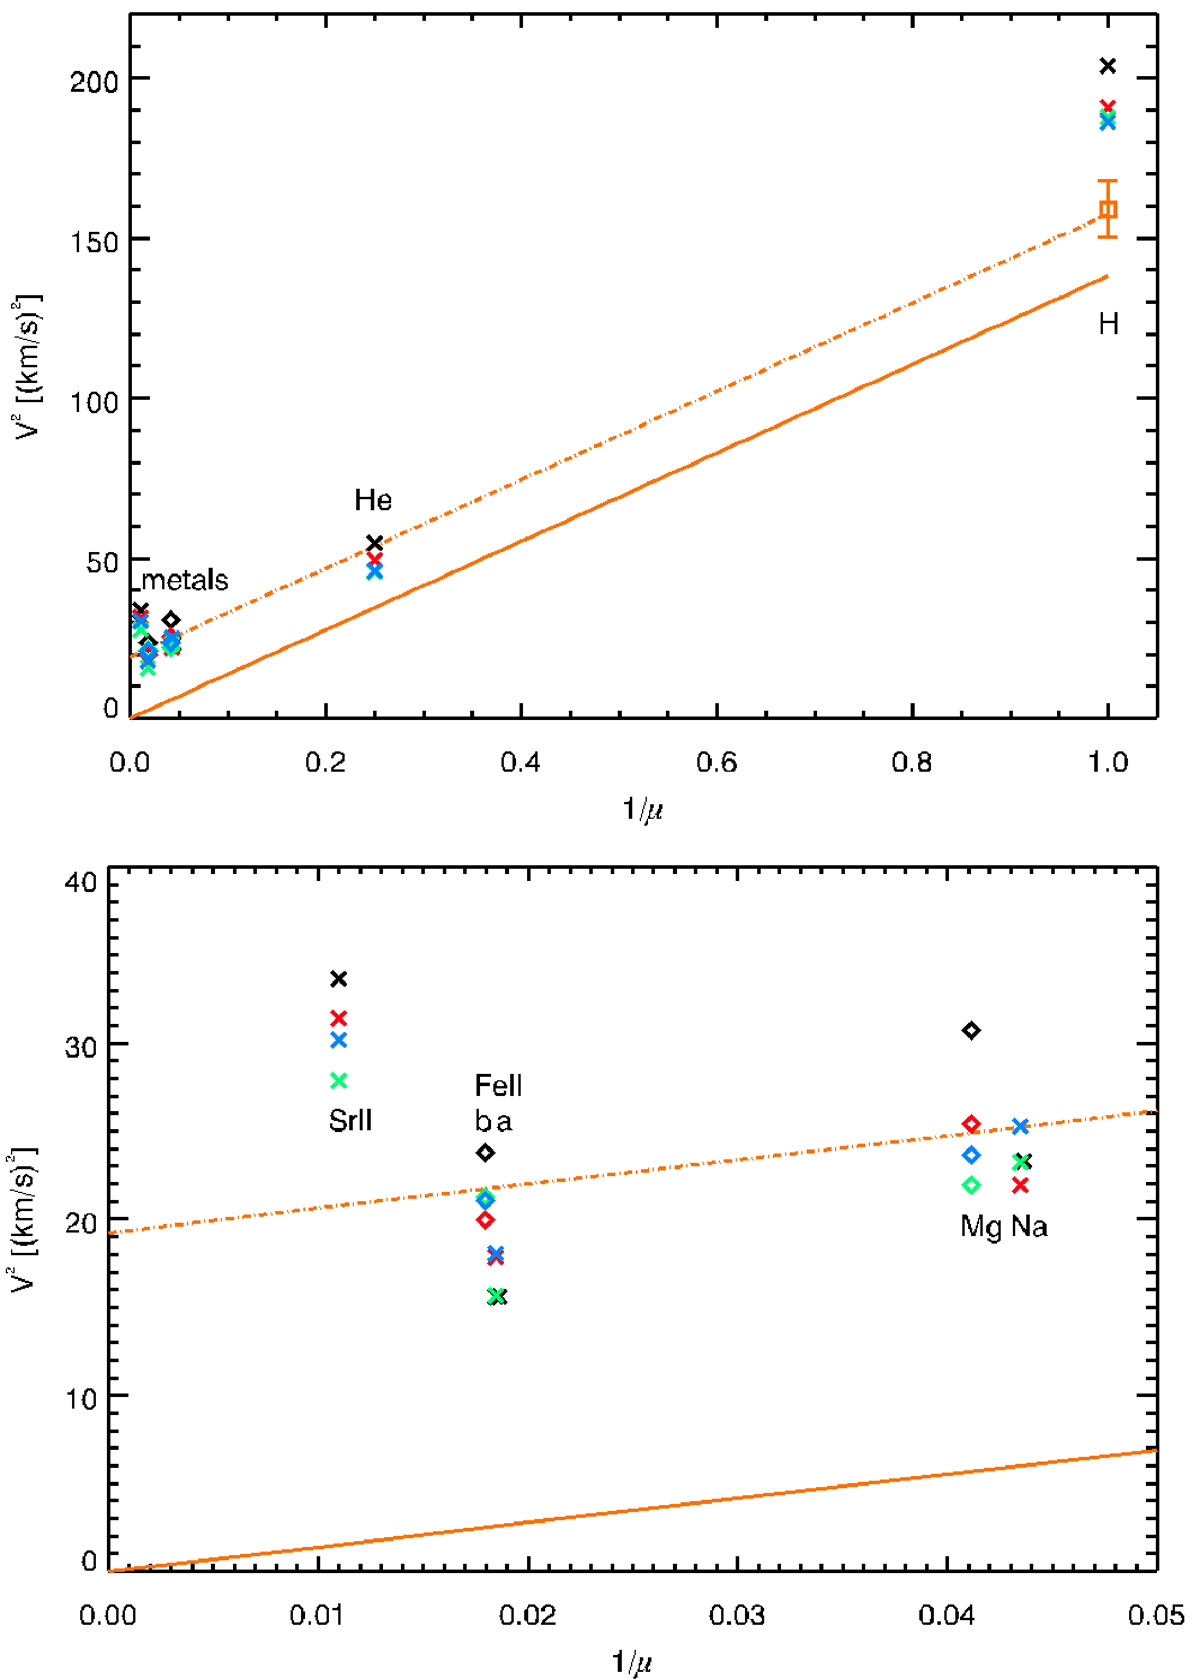
Fig. 3.
Download original image
Upper panel: Observed mean values of V2=(c·Δλw/λ0)2 versus the inverse atomic mass 1/μ for the four slit positions marked in Fig. 1. The dotted orange line represents a linear fit through all lines, and the solid orange line is used as reference for width excesses of the spectral lines. The diamonds for Fe II(b) and Mg b separate the close Fe II(a) and Na D values. The orange bar indicates the uncertainty of the opacity broadening of Hγ. Lower panel: Enlargement of the range of the metal lines. The position of Fe II(a) is slightly shifted to separate it from Fe II(b).
Current usage metrics show cumulative count of Article Views (full-text article views including HTML views, PDF and ePub downloads, according to the available data) and Abstracts Views on Vision4Press platform.
Data correspond to usage on the plateform after 2015. The current usage metrics is available 48-96 hours after online publication and is updated daily on week days.
Initial download of the metrics may take a while.