Fig. 8
Download original image
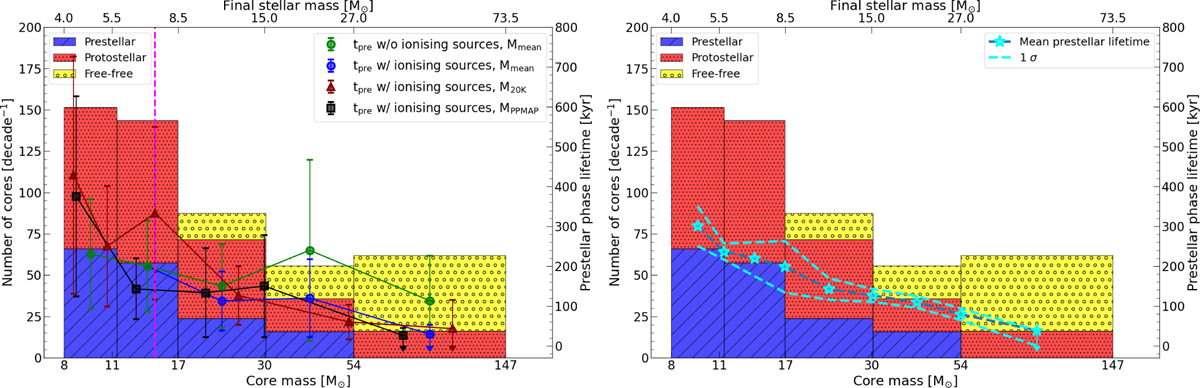
Left: weighted histogram of the number of prestellar and protostellar cores per bin and lifetime of the (massive) prestellar phase for each bin (points). The left y-axis indicates the density of number of cores per decade. Prestellar cores are shown in blue bars, protostellar cores in red, and free-free sources in yellow. The bins are built using the average mass adopted in Table A.1 (also available at the CDS). Prestellar lifetimes (right y-axis) are presented as green (without ionizing sources) and blue (with ionizing sources) points for the average mass adopted. We also display as brown and black points the histograms obtained using PSC masses for the lowest and highest dust temperatures respectively we considered in Table A.1 (also available at the CDS). The magenta dashed line represents the threshold in mass of the protostar to start ionizing its envelope. The upper x-axis represents the final stellar mass assuming a core to star efficiency ϵcse of 50%. Right: same histogram with the mean prestellar lifetime in cyan stars extracted along the range of PSC masses (blue, brown and black points in left panel). The cyan dashed lines represent the one-sigma dispersion.
Current usage metrics show cumulative count of Article Views (full-text article views including HTML views, PDF and ePub downloads, according to the available data) and Abstracts Views on Vision4Press platform.
Data correspond to usage on the plateform after 2015. The current usage metrics is available 48-96 hours after online publication and is updated daily on week days.
Initial download of the metrics may take a while.