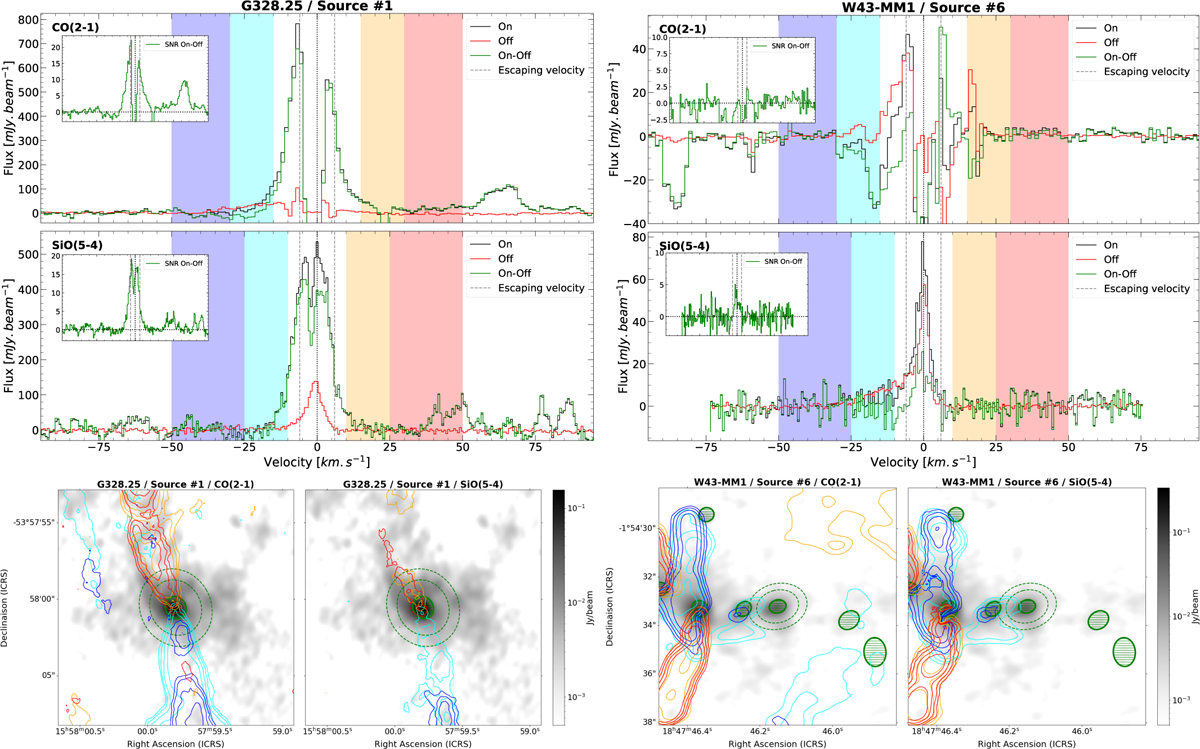
Fig. 4
Download original image
Top left: CO and SiO spectra of the protostellar source #1 of the G328.25 region. On, Off, and On–Off spectra are the black, red, and green spectra respectively. The insets in the top left corner of each spectrum are the signal-to-noise ratio (S/N) for On and On–Off spectra, revealing the significant part of each one. The colored spaces on the spectra are the velocity ranges used to make molecular outflows maps. Bottom left: zoomed-in image on source #1 of the G328.25 region driving a bipolar outflow. The contour colors are the same as in Fig. 3. The CO and SiO contours are 5, 10, 20, and 40 in units of σ, with σ = 60.1, 60.4, 61.9, 62.7 mJy beam−1 km s−1 for CO, and σ = 38.9, 49.0, 38.1, 49.6 mJy beam−1 km s−1 for SiO, for cyan, blue, orange and red contours respectively. Top right: same as top left, but for the prestellar source #6 of the W43-MM1 region. Bottom right: same as bottom left but for the prestellar source #6 of the W43-MM1 region. The CO and SiO contours are 10, 20, 40, and 80 in units of σ, with σ = 32.6, 18.6, 49.5, 15.3 mJy beam−1 km s−1 for CO, and σ = 6.4, 7.4, 7.3, 7.2 mJy beam−1 km s−1 for SiO, for cyan, blue, orange and red contours respectively.
Current usage metrics show cumulative count of Article Views (full-text article views including HTML views, PDF and ePub downloads, according to the available data) and Abstracts Views on Vision4Press platform.
Data correspond to usage on the plateform after 2015. The current usage metrics is available 48-96 hours after online publication and is updated daily on week days.
Initial download of the metrics may take a while.