Fig. 9.
Download original image
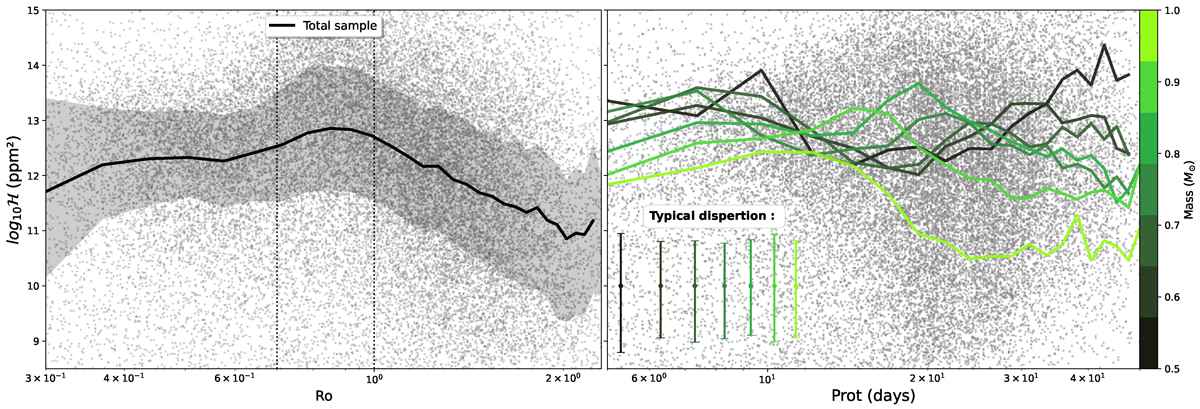
Scatter plot of the total sample of stars (grey dots in the background) as a function of the spot impact proxy and the rotation Rossby number (left) or period (right). On the left panel, the black line represents the median value of ℋ as a function of Ro for the whole sample. The hatched area around this line represents the interval of the quartiles. The dotted lines show the position of Ro = 0.7 and 1. For the right panel, these stars are grouped into slices of increasing masses (from 0.5 M⊙ in dark to 1 M⊙ in light green). The coloured lines represent the median values of ℋ for each of these mass samples. The typical on ℋ have been represented at the bottom left of the panel. They have been estimated by computing first quartiles around the median value. The large coloured dots mark the position of the maxima of these curves.
Current usage metrics show cumulative count of Article Views (full-text article views including HTML views, PDF and ePub downloads, according to the available data) and Abstracts Views on Vision4Press platform.
Data correspond to usage on the plateform after 2015. The current usage metrics is available 48-96 hours after online publication and is updated daily on week days.
Initial download of the metrics may take a while.