Fig. 6.

Download original image
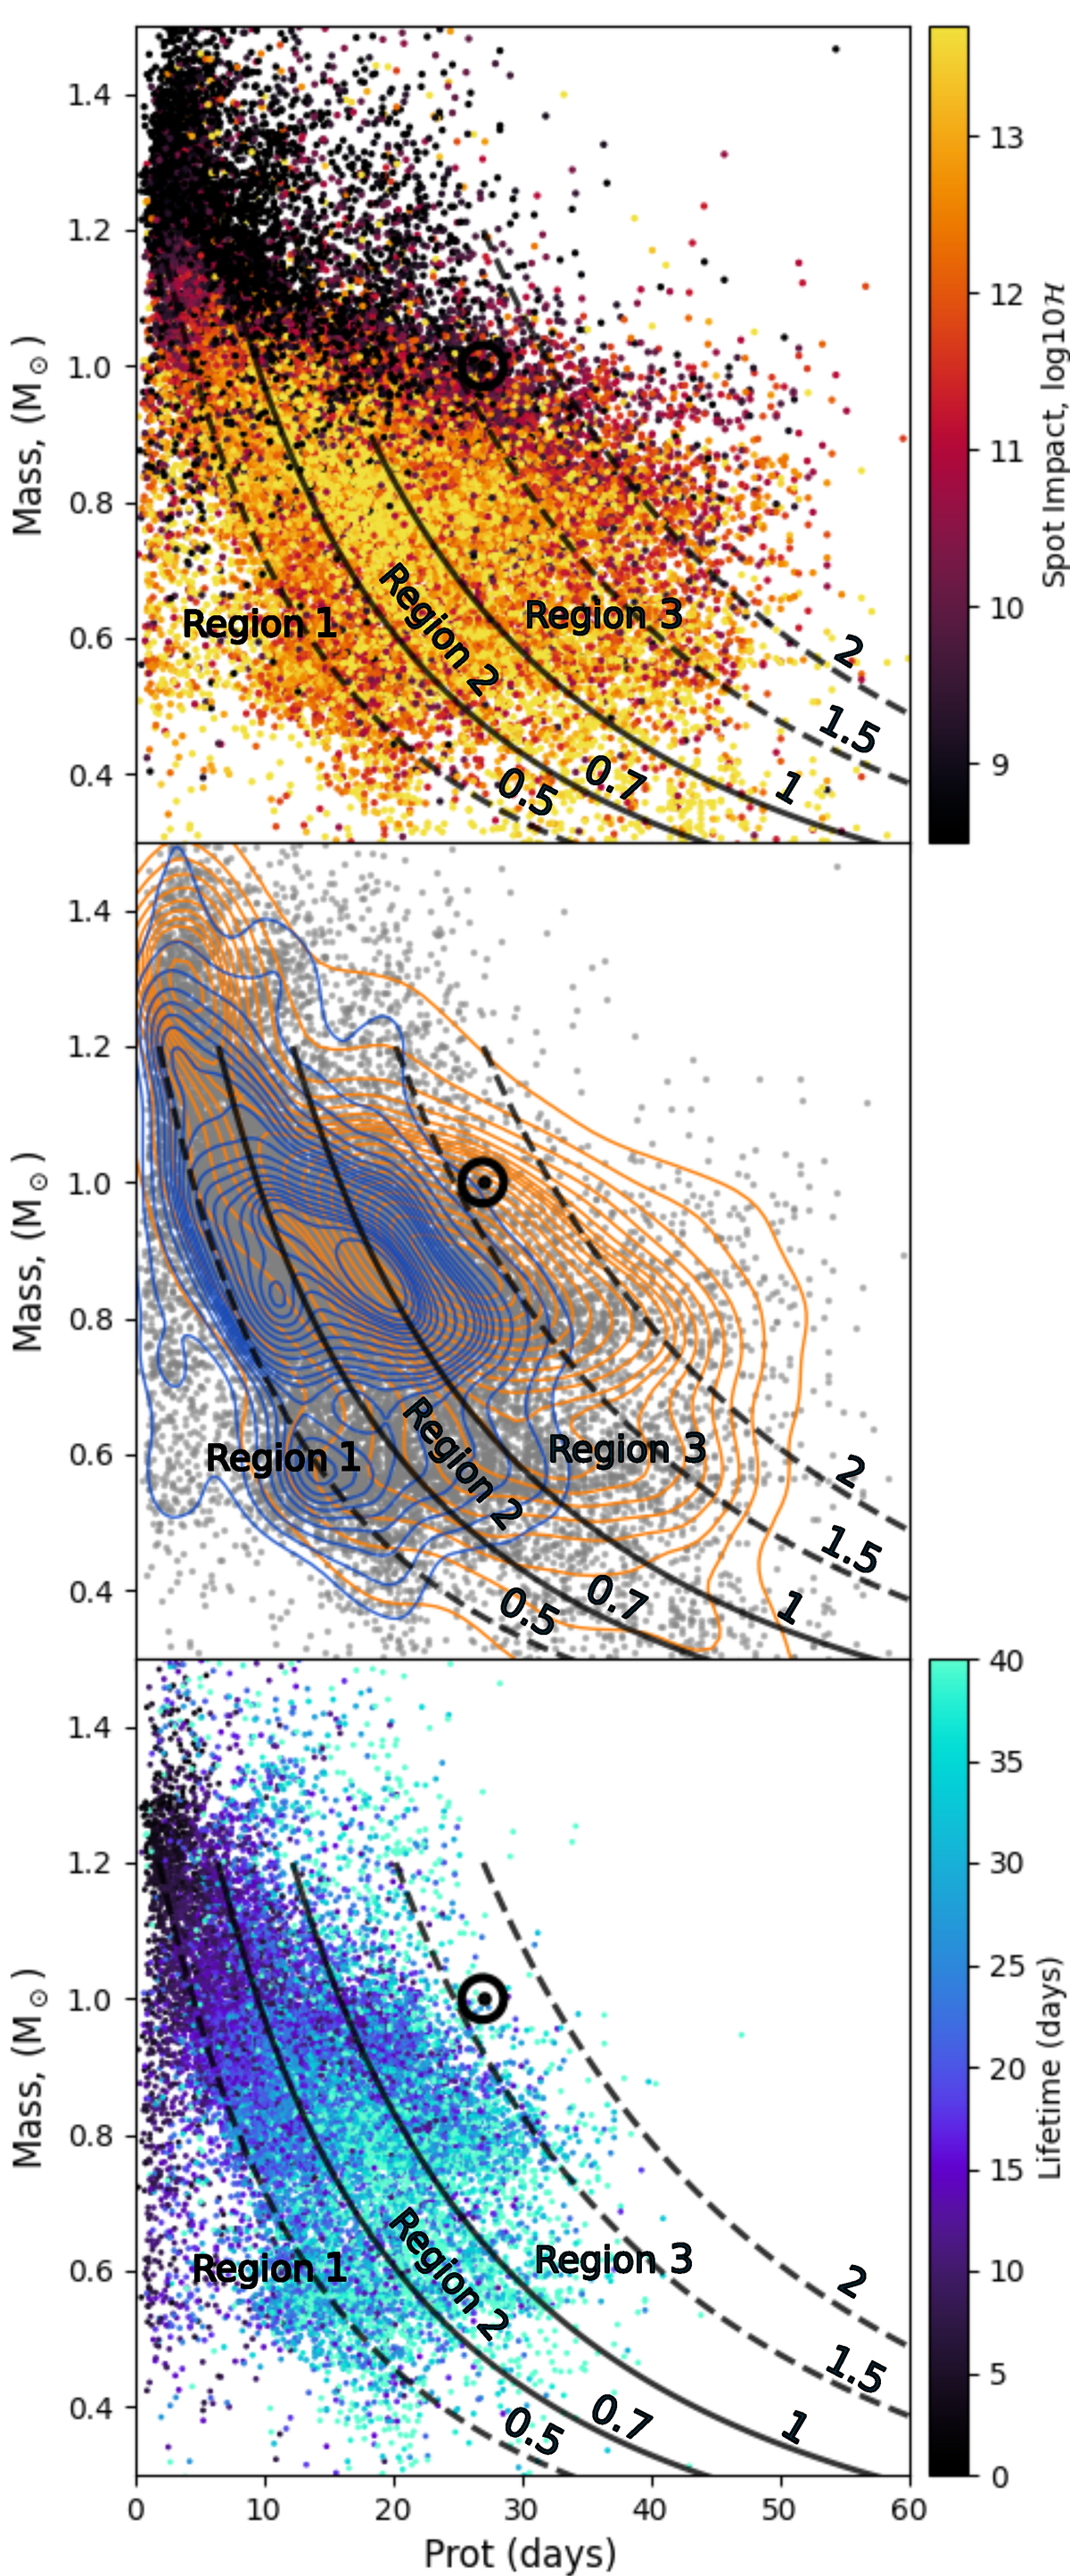
Top panel: Spot-impact proxy for the stellar sample as a function of mass and rotation period. The colour scale shows the impact proxy ℋ with a logarithmic scale. Yellow is for a large spot impact (active stars) and black for low spot impact (less active stars). The black lines represent the iso-lines of the Rossby number. The ⊙ point indicates the location of the Sun in this diagram. Middle panel: Same figure with contour lines showing the locations of the stars with ‘peakless’ or ‘with peaks’ spectra, respectively in orange and blue. The grey dots represent the whole sample. Bottom panel: Same as the top panel but with the lifetime proxy τlife. Only stars with spectra with peaks are presented.
Current usage metrics show cumulative count of Article Views (full-text article views including HTML views, PDF and ePub downloads, according to the available data) and Abstracts Views on Vision4Press platform.
Data correspond to usage on the plateform after 2015. The current usage metrics is available 48-96 hours after online publication and is updated daily on week days.
Initial download of the metrics may take a while.


