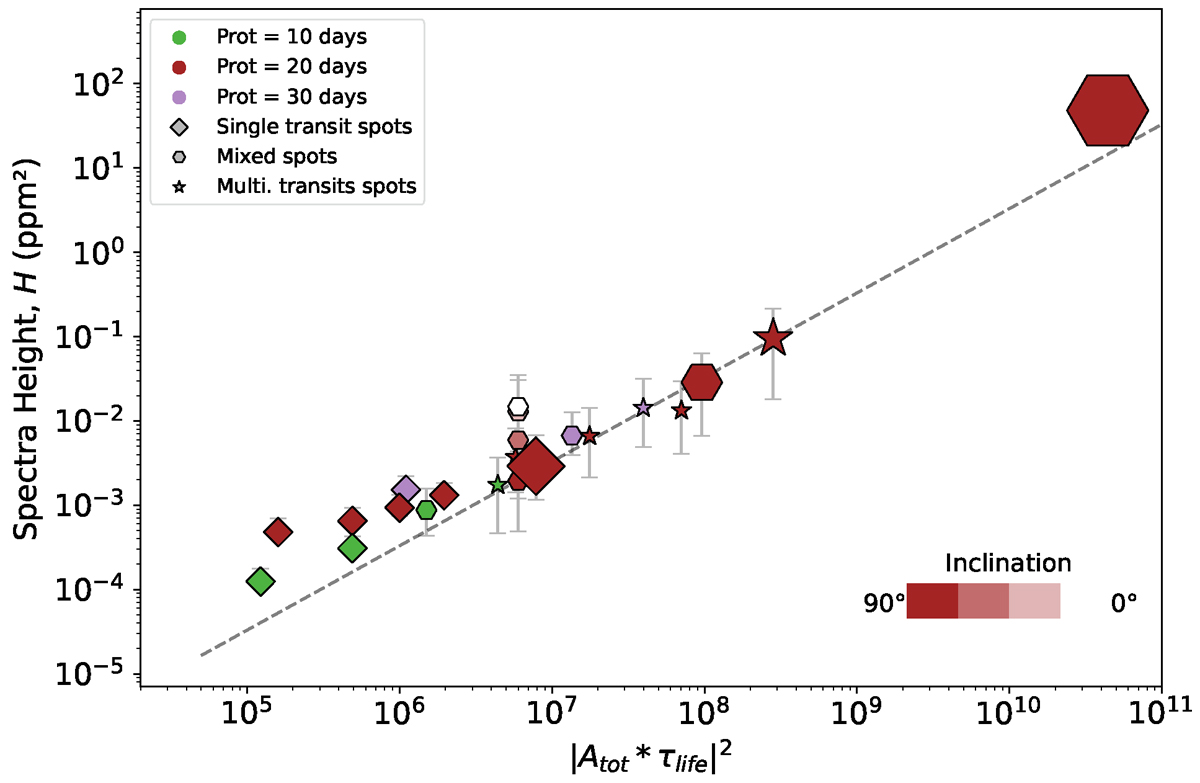
Fig. 3.
Download original image
Median height of the spectrum (ℋ) of each set of simulations as a function of |Atotτlife|2 (see Eq. (16)). The colour of the dots indicates the rotation period of the star (10 days in green, 20 days in red and 30 days in purple), while the shape gives the type of spot lifetime (diamonds for the peakless stars, hexagons for mixed spots and 5-pointed stars for stars with rotation peaks spectra). The size is proportional to the surface of the spots. The large hexagon on the top-right corresponds to set 19 with spots radii of 10 degrees. The error bars are based on the first and third quartile. The points with a shading towards white are the results for the 3 simulations where the inclination varies (sets 20, 21 and 22), white being for 0° inclination (set 22).
Current usage metrics show cumulative count of Article Views (full-text article views including HTML views, PDF and ePub downloads, according to the available data) and Abstracts Views on Vision4Press platform.
Data correspond to usage on the plateform after 2015. The current usage metrics is available 48-96 hours after online publication and is updated daily on week days.
Initial download of the metrics may take a while.