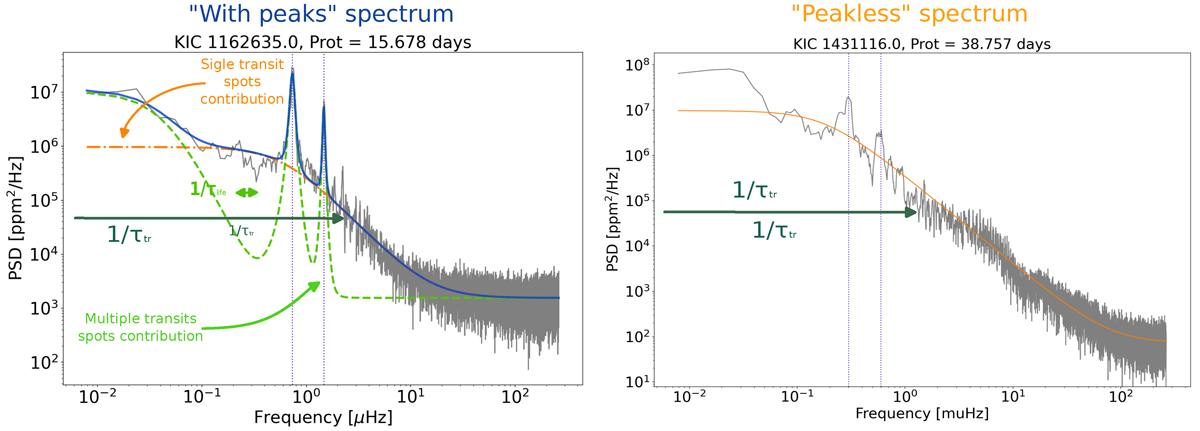
Fig. 2.
Download original image
Left panel: Example of a power spectra density of a Kepler LC (grey) ‘with peaks’ fitted by the model detailed in Sect.2. The transit component due to the single-transit spots is dash-dotted orange line, the multiple-transit spots component in a dashed light green line and the total fit in blue. The rotation peaks are marked by purple dashed lines. Right panel: Example of a peakless power spectra density of a star where the Harvey profile is used for the fit.
Current usage metrics show cumulative count of Article Views (full-text article views including HTML views, PDF and ePub downloads, according to the available data) and Abstracts Views on Vision4Press platform.
Data correspond to usage on the plateform after 2015. The current usage metrics is available 48-96 hours after online publication and is updated daily on week days.
Initial download of the metrics may take a while.