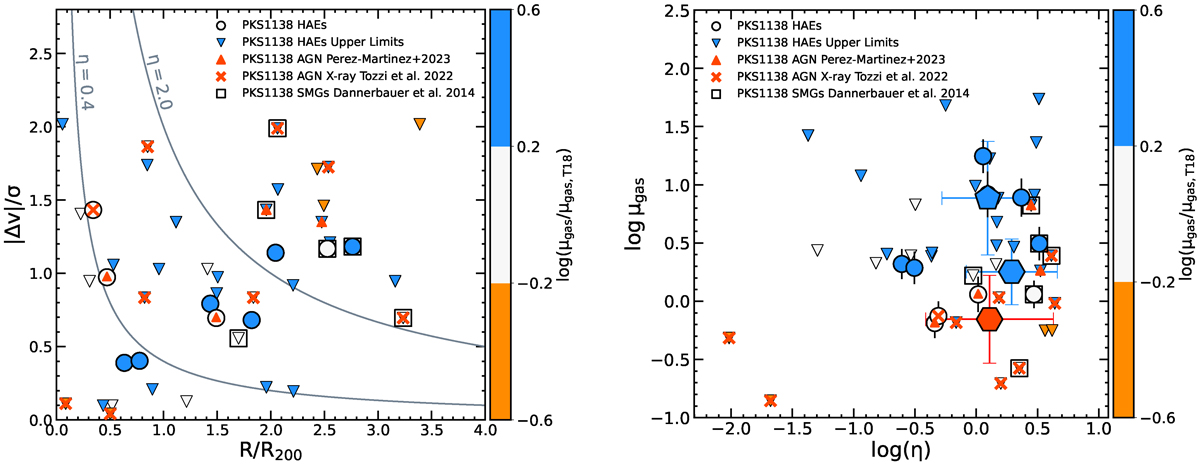
Fig. 9.
Download original image
Left: Phase space diagram. Objects are color-coded by their molecular to stellar mass ratio μgas offsets with respect to the scaling relation of Tacconi et al. (2018). Solid grey lines divide the phase space into three regimes with galaxies being in the outskirts (η ≥ 2), infalling (0.4 ≤ η ≤ 2) or central regions (η ≤ 0.4) similarly to Pérez-Martínez et al. (2023). CO(1−0) measurements at S/N > 4 are depicted as solid circles while inverted triangles show upper limits. Right: Molecular to stellar mass ratio (μgas) offsets from the scaling relation as a function of the environmental parameter η. In addition, the pentagon and two hexagons depict the three stellar mass and AGN activity bins presented in Table 2. The remaining symbols and colors remain the same as in the left-hand diagram.
Current usage metrics show cumulative count of Article Views (full-text article views including HTML views, PDF and ePub downloads, according to the available data) and Abstracts Views on Vision4Press platform.
Data correspond to usage on the plateform after 2015. The current usage metrics is available 48-96 hours after online publication and is updated daily on week days.
Initial download of the metrics may take a while.