Fig. 6.
Download original image
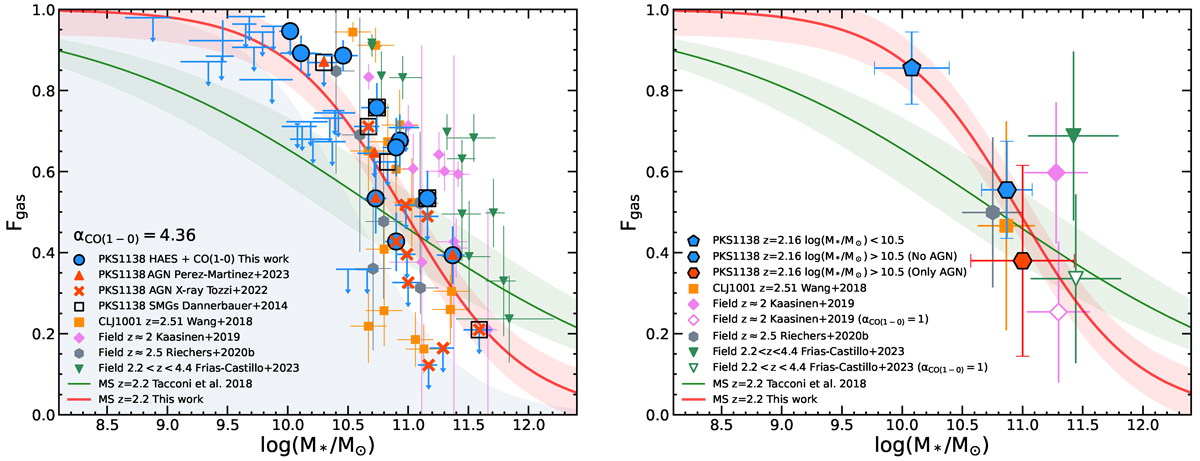
Left: Total gas fraction versus stellar mass diagram. The solid green line and shaded region represent the field scaling relations for Main Sequence (MS) galaxies from Tacconi et al. (2018). We overplot our sample in blue color (both for measurements and upper limits) and compare it with other protocluster samples at the cosmic noon such as Wang et al. (2018) in orange, and coeval field samples (Kaasinen et al. 2019 in pink; Riechers et al. 2020 in grey; Frias Castillo et al. 2023 in green). In addition, we marked those galaxies with signs of AGN activity with red crosses (X-ray emission, Tozzi et al. 2022a) and red triangles (high [NII]/Hα, Pérez-Martínez et al. 2023) and those identified as SMGs by Dannerbauer et al. (2014) as black empty squares. The solid red line and red area depict the fit and uncertainty of the PKS1138 and CLJ1001 protocluster samples using a logistic function, as proposed by Popping et al. (2012). The grey shaded area displays the 1σ detection limit given by the median rms of the entire ATCA mosaic. Right: Total gas fraction versus stellar mass diagram after stacking. Our sample is divided into three bins: Low-mass galaxies (log M*/M⊙ < 10.5); massive galaxies (log M*/M⊙ > 10.5) excluding AGN candidates; and massive AGN candidates. In addition, median values and standard deviations for the comparison samples are displayed using the same symbol and color scheme as in the left-hand panel. The empty symbols depict the median values of the Kaasinen et al. (2019) and Frias Castillo et al. (2023) field samples after applying αCO ≈ 1, typical of high-z starbursts and SMGs (see Sects. 4.1 and 4.2). We apply a 0.02 dex cosmetic shift in M* to these two data points to improve the visibility of their error bars.
Current usage metrics show cumulative count of Article Views (full-text article views including HTML views, PDF and ePub downloads, according to the available data) and Abstracts Views on Vision4Press platform.
Data correspond to usage on the plateform after 2015. The current usage metrics is available 48-96 hours after online publication and is updated daily on week days.
Initial download of the metrics may take a while.