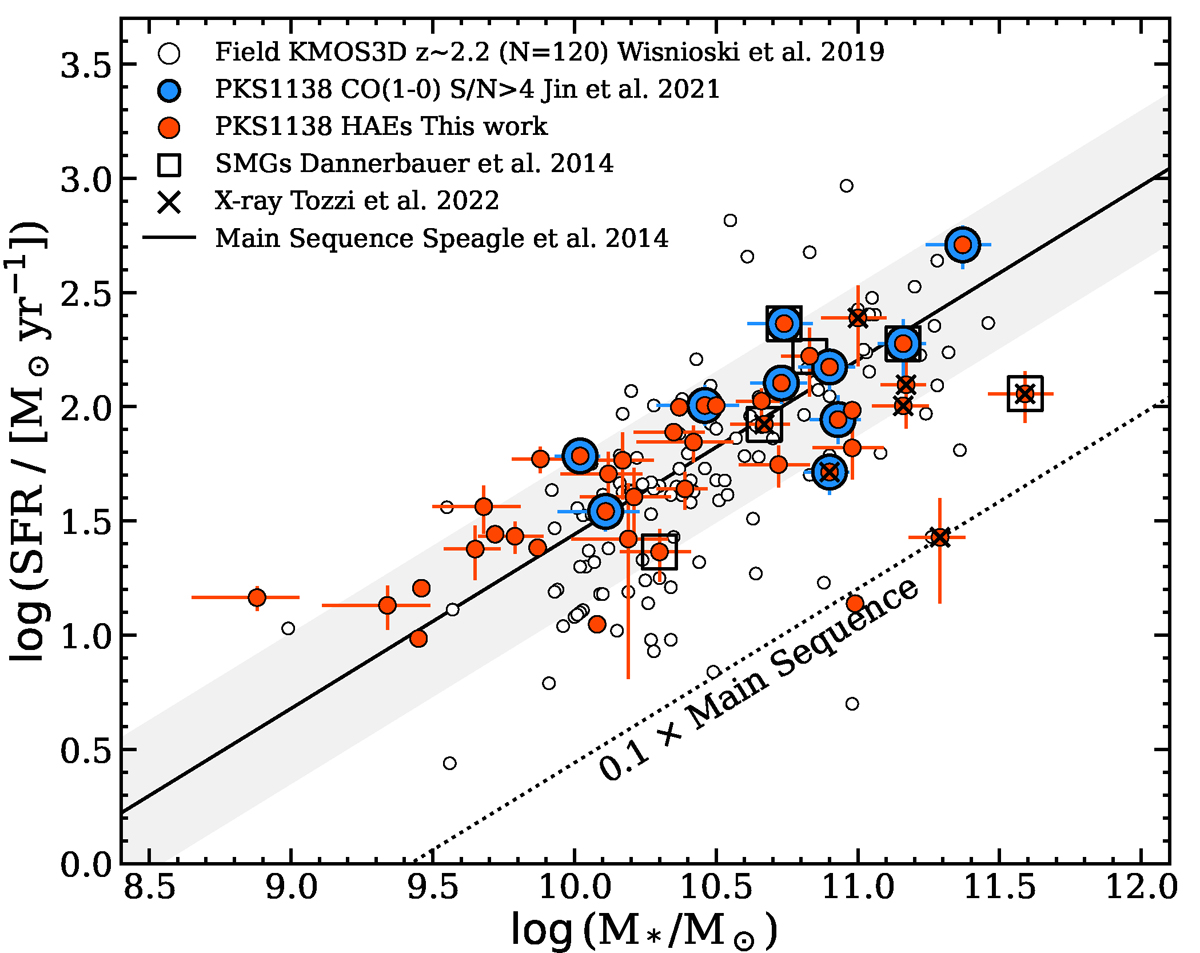
Fig. 5.
Download original image
Star-forming main sequence diagram. The black solid line and shaded grey region depict the Main Sequence of star formation at z = 2.16 from Speagle et al. (2014). Red small circles the spectroscopically confirmed HAEs of Shimakawa et al. (2018b) and Pérez-Martínez et al. (2023) within the ATCA datacube footprint. Blue circles show the location of the CO(1−0) emitters at S/N > 4 from Jin et al. (2021) which are part of our sample of HAEs. For context, we also add empty squares to show the overlap with the sample of SMGs in this field from Dannerbauer et al. (2014) and with the X-ray emitters reported by Tozzi et al. (2022a).
Current usage metrics show cumulative count of Article Views (full-text article views including HTML views, PDF and ePub downloads, according to the available data) and Abstracts Views on Vision4Press platform.
Data correspond to usage on the plateform after 2015. The current usage metrics is available 48-96 hours after online publication and is updated daily on week days.
Initial download of the metrics may take a while.