Fig. 3.
Download original image
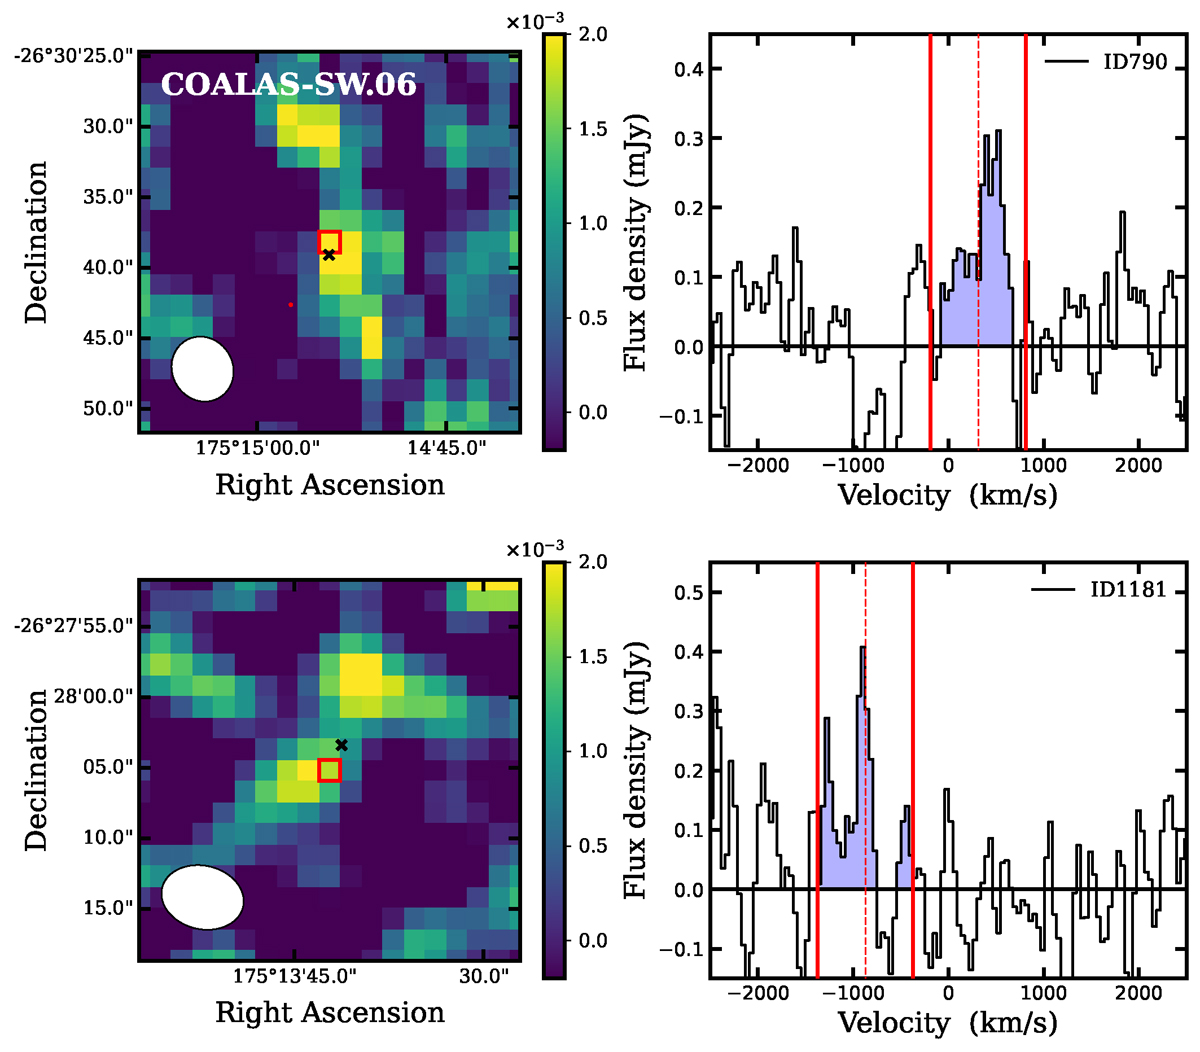
Two examples of our upper limit determination method. The upper panels display the HAE ID 790 for which Jin et al. (2021) reported CO(1−0) at S/N > 4, while the lower panel displays an undetected CO(1−0) source (HAE ID 1181) for which we compute upper limits. The first column displays the moment zero of the ATCA datacube after collapsing it at the redshift of our source ±500 km/s. The black cross shows the exact position of the HAE under scrutiny. The red empty square shows the position of the spaxel containing the peak flux after inspecting a 3 × 3 grid around the HAEs spaxel. The beam size is shown in the lower left corner. The second column depicts the spectra extracted from the peak flux spaxel. The vertical red dashed line shows the systemic velocity (i.e., redshift) of the galaxy from Hα while the solid red lines display the limits (±500 km/s) for flux integration (blue area). Velocities are relative to z = 2.1612 as in Jin et al. (2021).
Current usage metrics show cumulative count of Article Views (full-text article views including HTML views, PDF and ePub downloads, according to the available data) and Abstracts Views on Vision4Press platform.
Data correspond to usage on the plateform after 2015. The current usage metrics is available 48-96 hours after online publication and is updated daily on week days.
Initial download of the metrics may take a while.