Fig. 12.
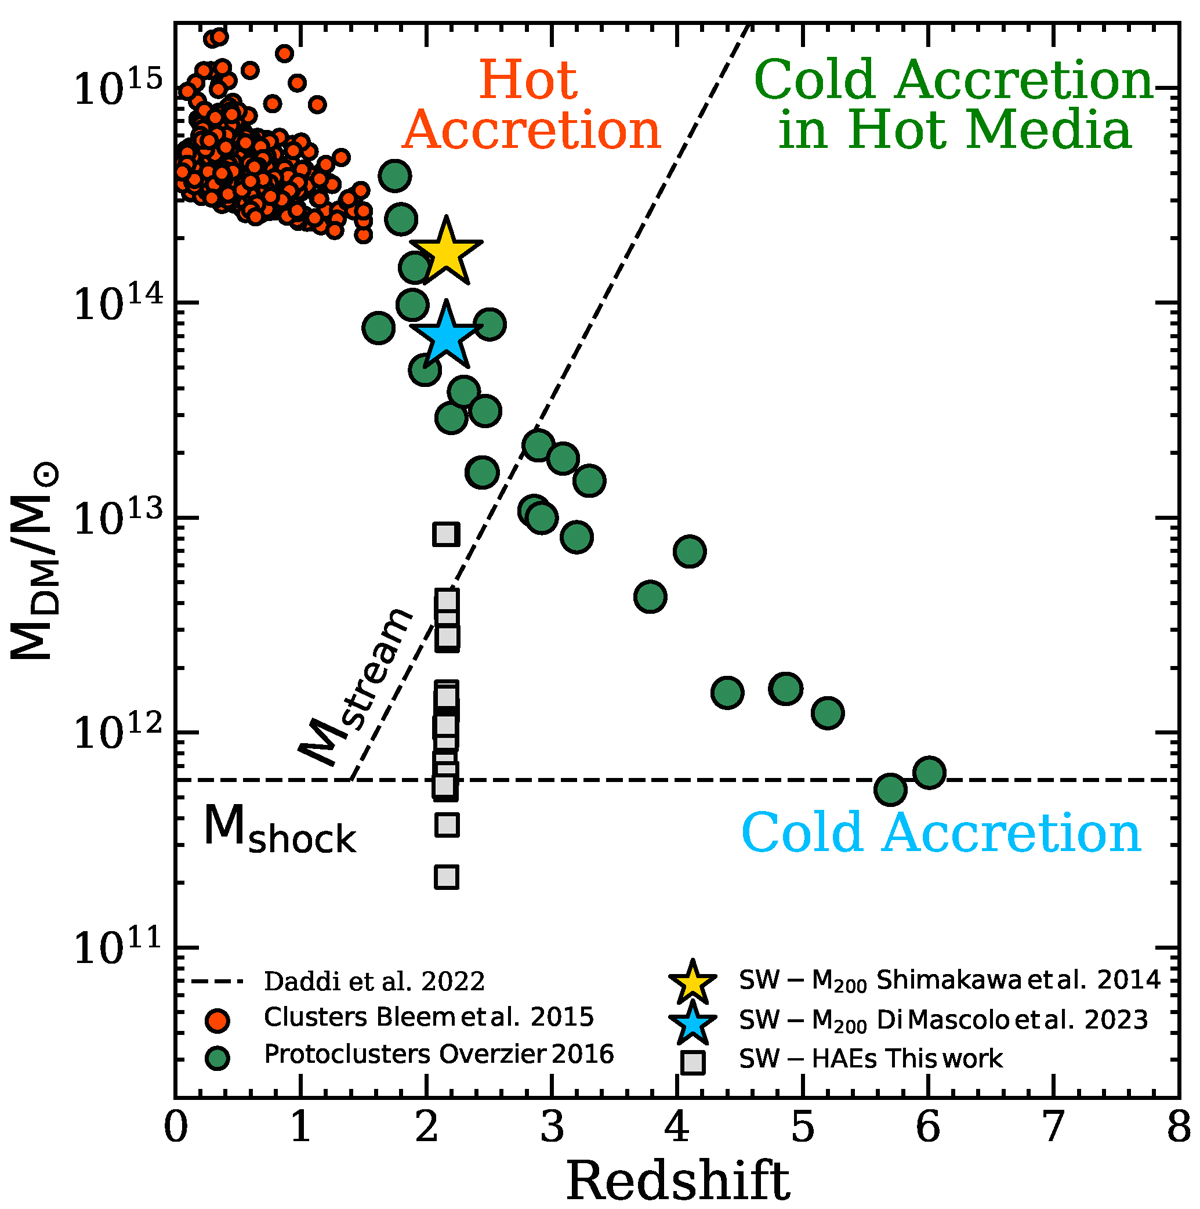
Download original image
Accretion regime diagram. Colored stars display the dark matter halo mass of the Spiderweb protocluster derived using the SZ effect and dynamical estimates by Di Mascolo et al. (2023) and Shimakawa et al. (2014) respectively. Grey squares depict the position of our sample of HAES after applying the stellar-to-halo mass relation in Behroozi et al. (2019) for satellite galaxies (see Sect. 5.1). For comparison, we use green big circles to show a sample of protoclusters from Overzier (2016) while the small red circles represent a sample of SZ-detected z < 1.5 clusters from Bleem et al. (2015).
Current usage metrics show cumulative count of Article Views (full-text article views including HTML views, PDF and ePub downloads, according to the available data) and Abstracts Views on Vision4Press platform.
Data correspond to usage on the plateform after 2015. The current usage metrics is available 48-96 hours after online publication and is updated daily on week days.
Initial download of the metrics may take a while.