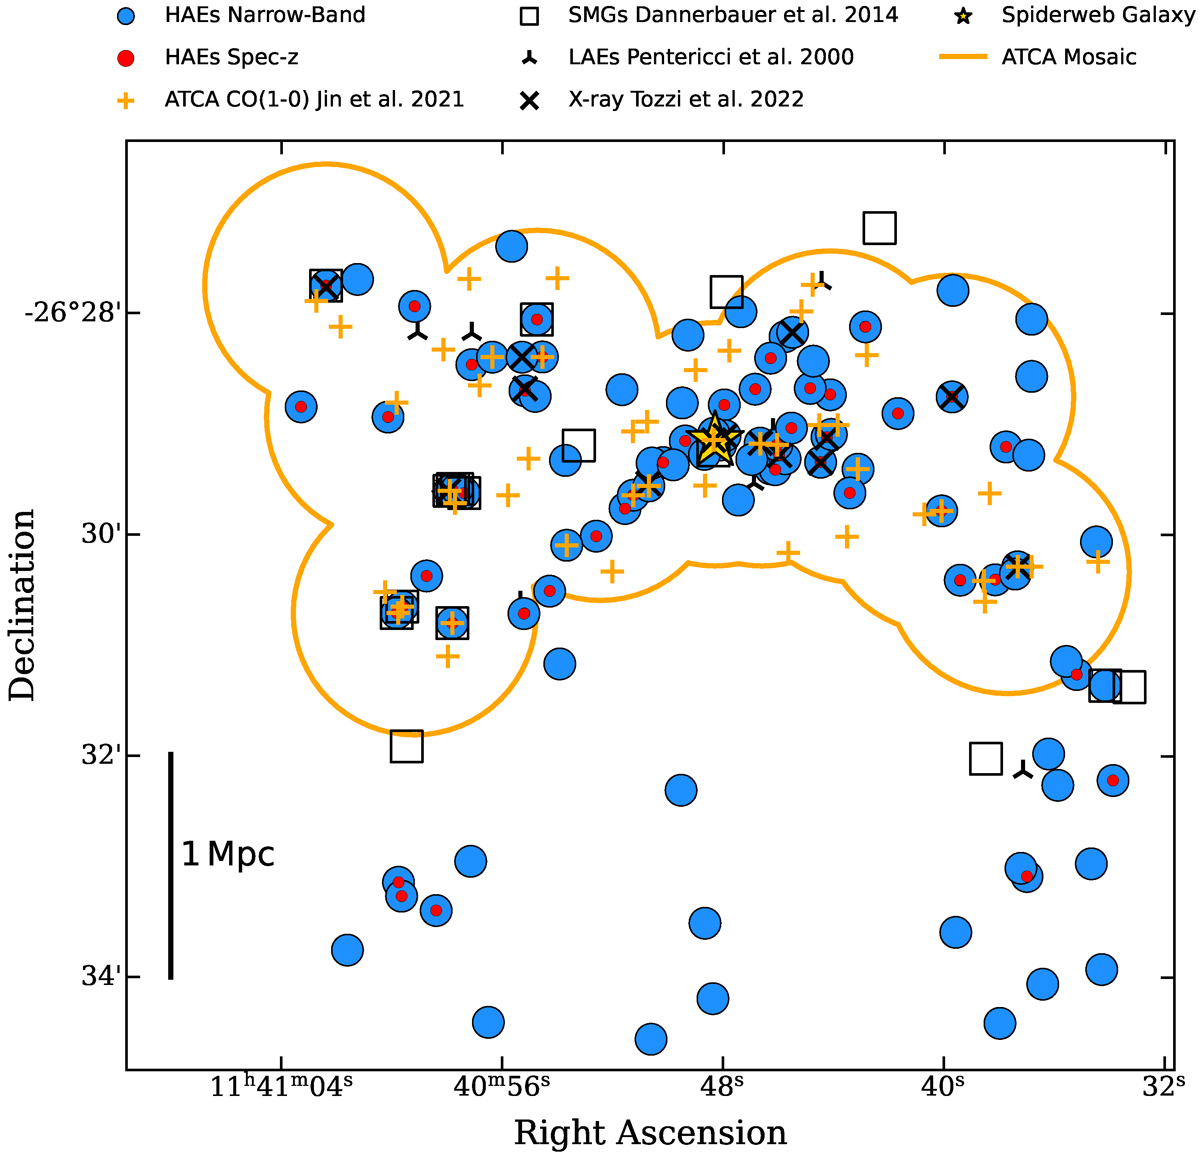
Fig. 1.
Download original image
Spiderweb protocluster field at z ≈ 2.16. Blue circles display the full sample of candidate HAEs from Koyama et al. (2013) and Shimakawa et al. (2018b). Red circles show those HAEs with measured spectroscopic redshift (Shimakawa et al. 2018b; Pérez-Martínez et al. 2023). Orange crosses and contours respectively show the CO(1−0) emitters reported by Jin et al. (2021) and the limits of the COALAS ATCA footprint. Empty squares depict the subsample of SMGs reported by Dannerbauer et al. (2014) in this field. Black stars show the LAEs from Pentericci et al. (2000), while X-ray sources from Tozzi et al. (2022a) are shown by black crosses. The Spiderweb galaxy is marked with a yellow star. We display a bar with 1 Mpc physical scale at z = 2.16 in the lower-left corner of the diagram for reference.
Current usage metrics show cumulative count of Article Views (full-text article views including HTML views, PDF and ePub downloads, according to the available data) and Abstracts Views on Vision4Press platform.
Data correspond to usage on the plateform after 2015. The current usage metrics is available 48-96 hours after online publication and is updated daily on week days.
Initial download of the metrics may take a while.