Fig. 2.
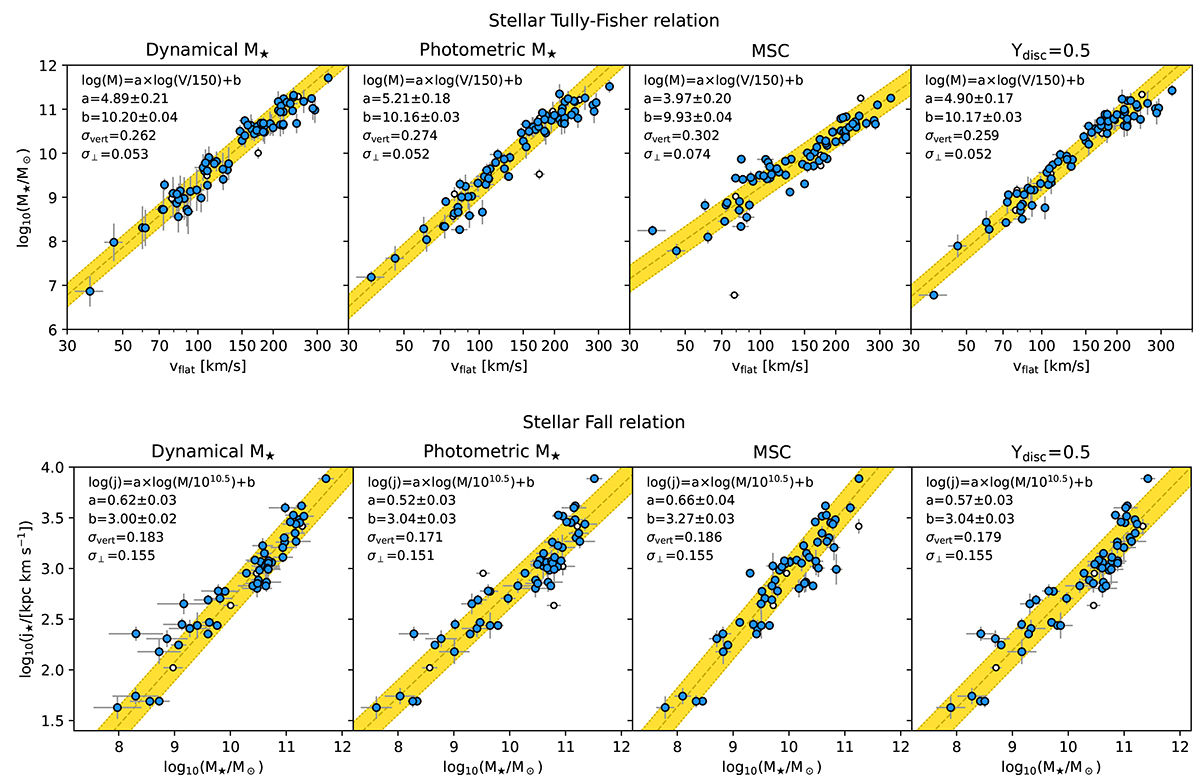
Download original image
Stellar Tully-Fisher relation (top panels) and Fall relation (bottom panels) for SPARC galaxies with M⋆ determined using the dynamical method (first column), the photometric method (second column), the MSC method (third column), and Equation (1) with Υdisc = 0.5 (fourth column). Only galaxies for which all four M⋆ estimates are available are shown. Galaxies with p(> χ2) above and below 0.05 are shown with filled and open circles, respectively. In each panel, the dashed black line shows the best linear fit to the filled circles, with the yellow band representing the vertical observed scatter (σM⋆ or σj⋆). The best-fit parameters are reported in Table 1 and on the top left portion of each panel.
Current usage metrics show cumulative count of Article Views (full-text article views including HTML views, PDF and ePub downloads, according to the available data) and Abstracts Views on Vision4Press platform.
Data correspond to usage on the plateform after 2015. The current usage metrics is available 48-96 hours after online publication and is updated daily on week days.
Initial download of the metrics may take a while.