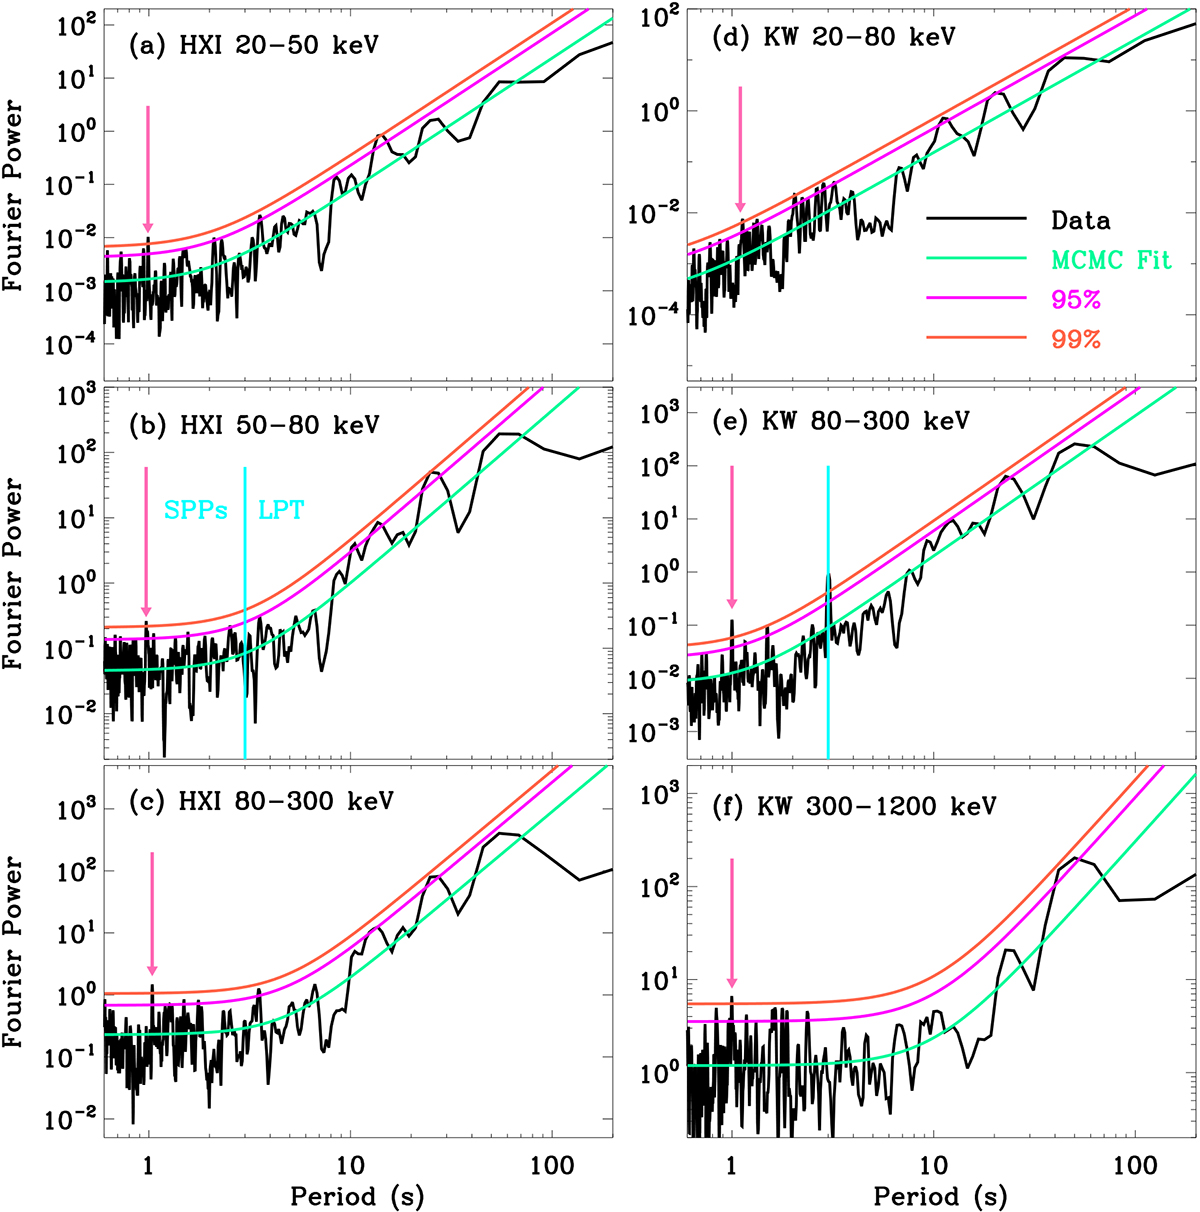
Fig. 2.
Download original image
Fourier PSDs and their MCMC fit results in log-log space. The spring green line in each panel indicates the MCMC fit for the observational data (black), the magenta, and tomato lines represent the confidence levels at 95% and 99%, respectively. The hot pink arrow outlines the interested period above the 99% confidence level. The vertical cyan line divides the spectrum into SPPs and LPT components.
Current usage metrics show cumulative count of Article Views (full-text article views including HTML views, PDF and ePub downloads, according to the available data) and Abstracts Views on Vision4Press platform.
Data correspond to usage on the plateform after 2015. The current usage metrics is available 48-96 hours after online publication and is updated daily on week days.
Initial download of the metrics may take a while.