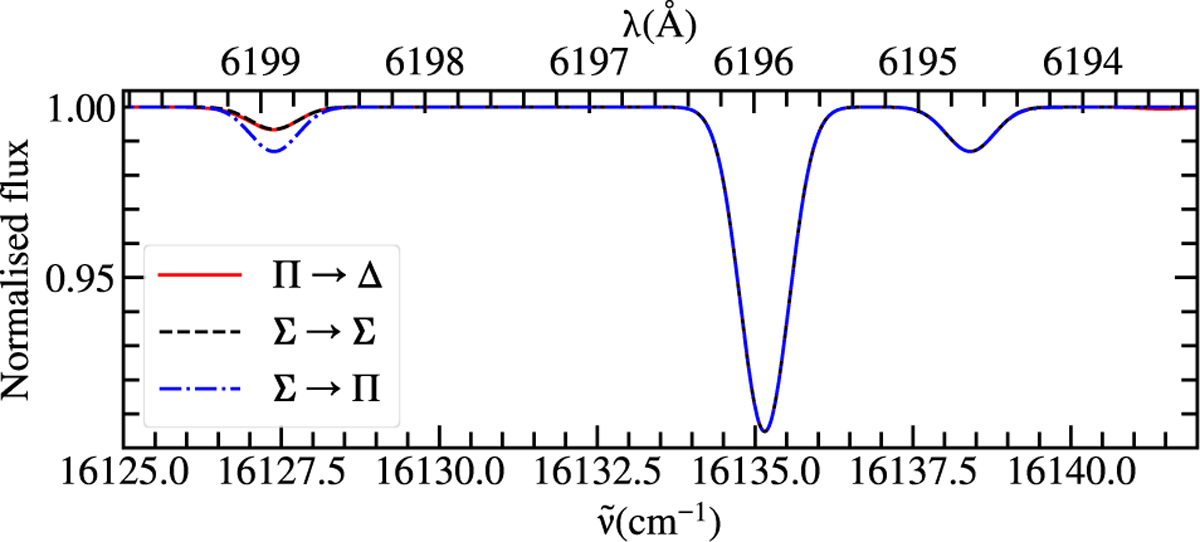
Fig. B.1
Download original image
Comparison between a Π → Δ (red, Trot = 5.24 K), Σ → Σ (dashed black, Trot = 2.17 K) and Σ → Π (dash-dotted blue, Trot = 4.59 K) transition. The rotational temperatures are matched, so that the models have the same line ratio of the two strongest transitions. In this temperature range, the Π → Δ and Σ → Σ models have the same line ratios, but different temperatures. The Σ → Π model has a stronger transition at lower wave numbers, which is as strong as the weak transition at higher wave numbers.
Current usage metrics show cumulative count of Article Views (full-text article views including HTML views, PDF and ePub downloads, according to the available data) and Abstracts Views on Vision4Press platform.
Data correspond to usage on the plateform after 2015. The current usage metrics is available 48-96 hours after online publication and is updated daily on week days.
Initial download of the metrics may take a while.