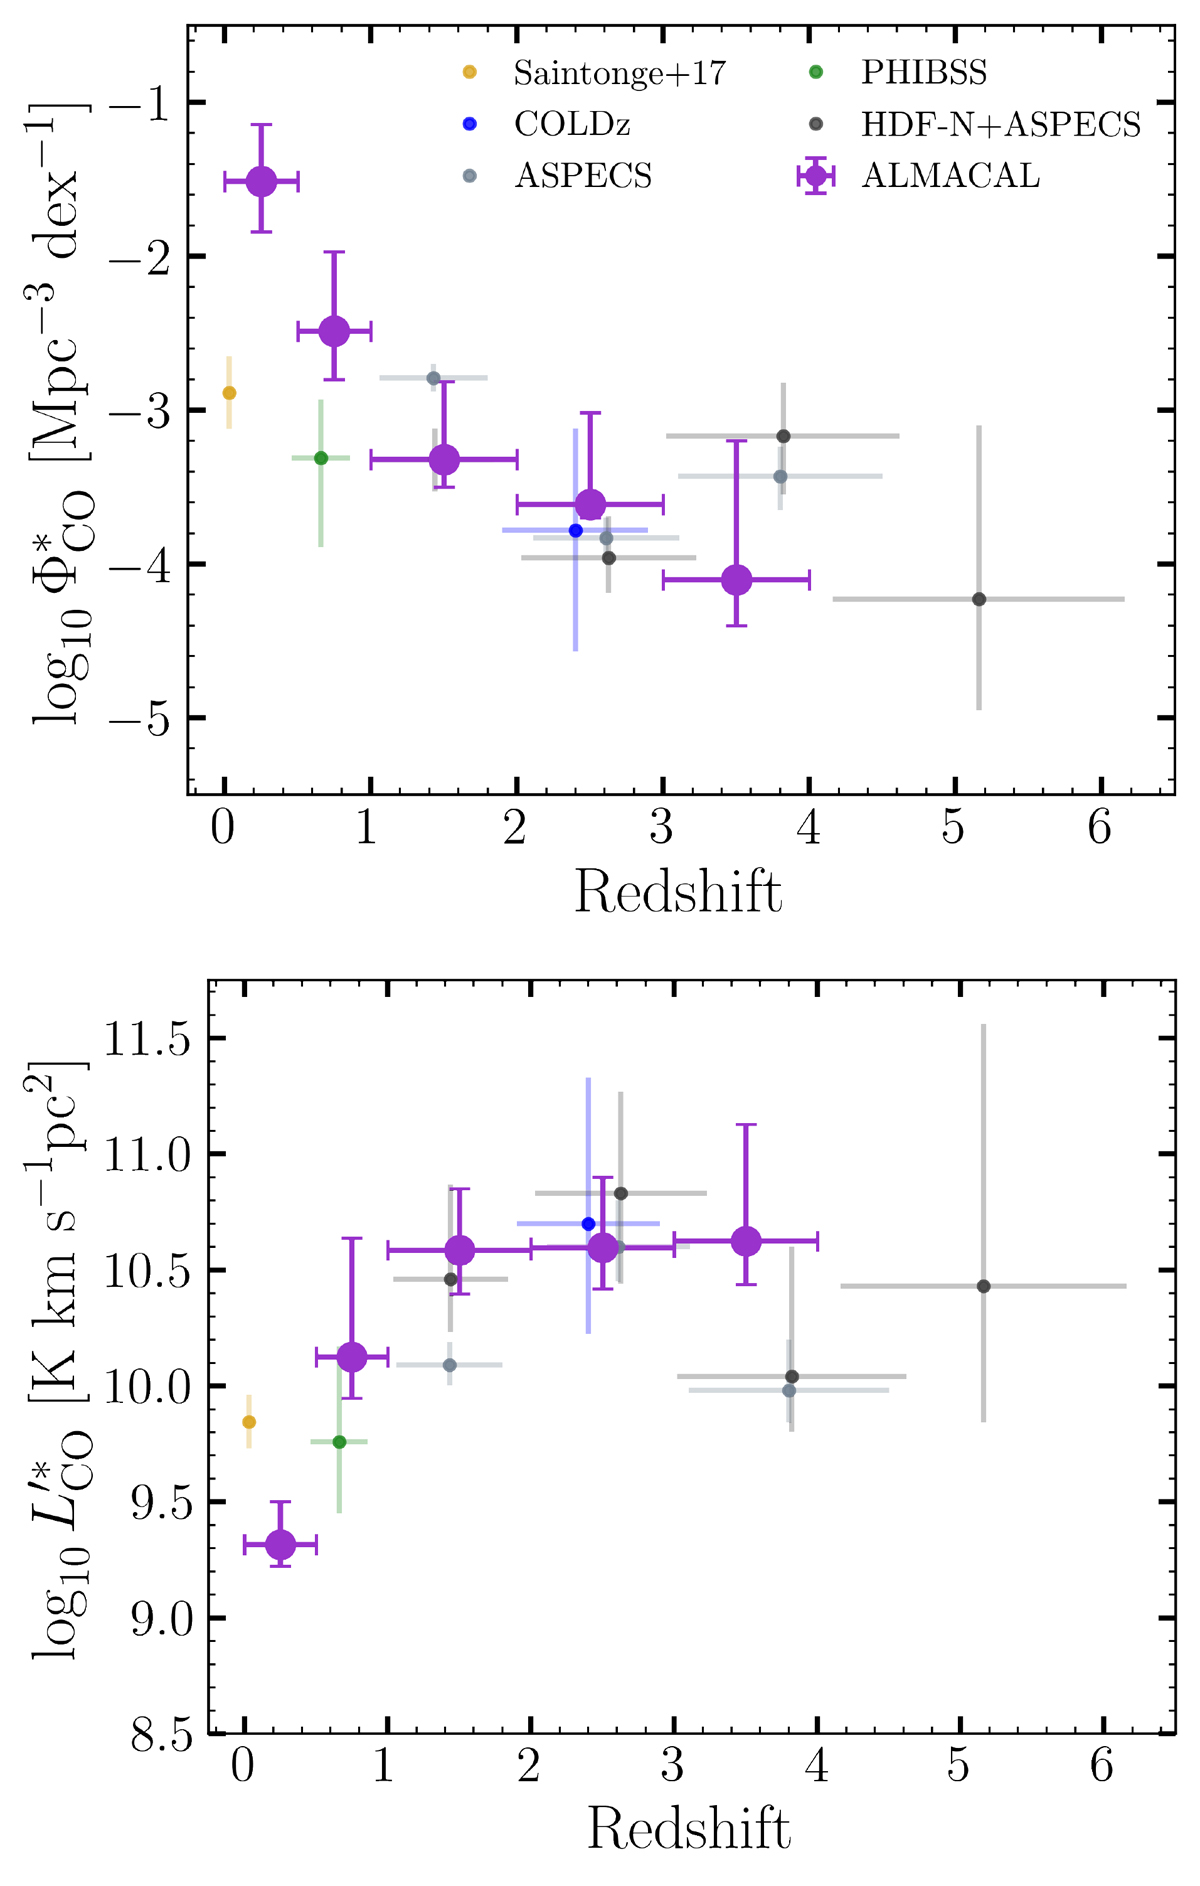
Fig. 8.
Download original image
Evolution of the Schechter best-fit parameters for the CO LF across z ∼ 0 to z ∼ 6. Top: evolution of Φ* shows a decrease with redshift from z = 0. Bottom: evolution of LCO* shows a consistent increase from z ∼ 0 to z ∼ 2, and remains roughly constant at higher redshifts. For the fits shown in Fig. 5, the faint-end slope was fixed at α = −0.2.
Current usage metrics show cumulative count of Article Views (full-text article views including HTML views, PDF and ePub downloads, according to the available data) and Abstracts Views on Vision4Press platform.
Data correspond to usage on the plateform after 2015. The current usage metrics is available 48-96 hours after online publication and is updated daily on week days.
Initial download of the metrics may take a while.