Fig. 5.

Download original image
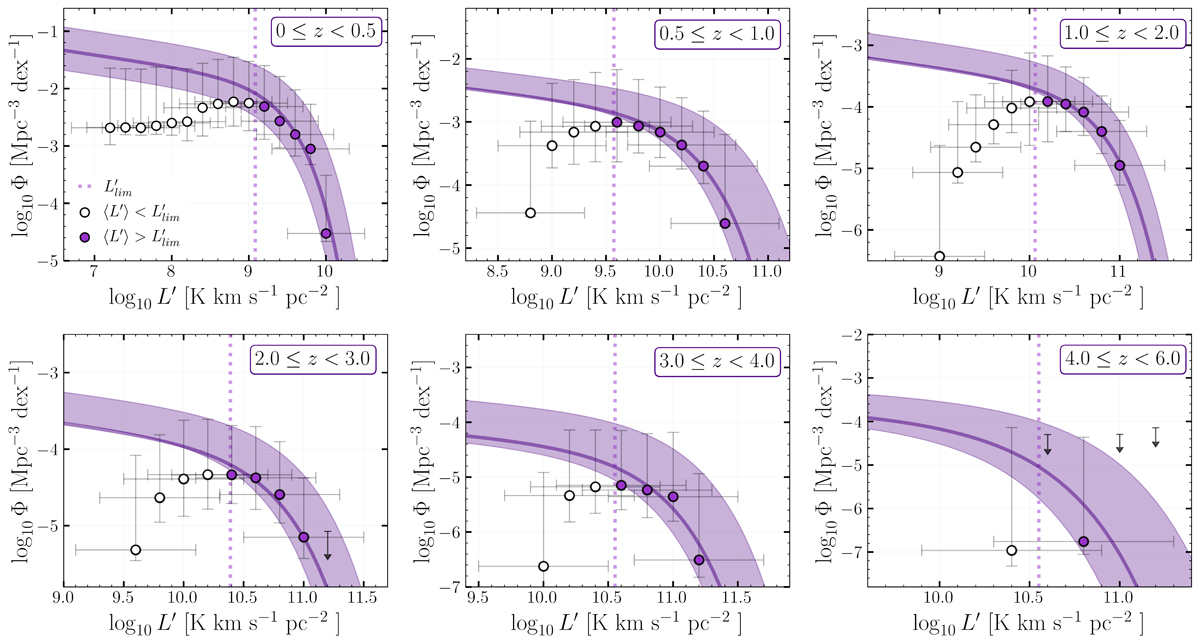
CO LF across redshift bins: z = 0–0.5, z = 0.5–1, z = 1–2, z = 2–3, z = 3–4 and z = 4–6. Detections are shown in circles and non-detection as arrows. The vertical dotted line in each panel indicates the detection limit, representing the faintest luminosity detectable at a 50% reduction in primary beam sensitivity. The CO LFs are fitted using only the filled points that lie above this luminosity threshold. The best-fit Schechter function (Schechter 1976) is plotted, with Φ* and L′* allowed to vary freely, while the faint-end slope is fixed at α = −0.2. The shaded region represents 1σ confidence intervals. Overall, the CO LF reveals a decreasing normalisation factor, while the ‘knee’ of the function shifts to higher luminosities as redshift increases.
Current usage metrics show cumulative count of Article Views (full-text article views including HTML views, PDF and ePub downloads, according to the available data) and Abstracts Views on Vision4Press platform.
Data correspond to usage on the plateform after 2015. The current usage metrics is available 48-96 hours after online publication and is updated daily on week days.
Initial download of the metrics may take a while.


