Fig. 3.
Download original image
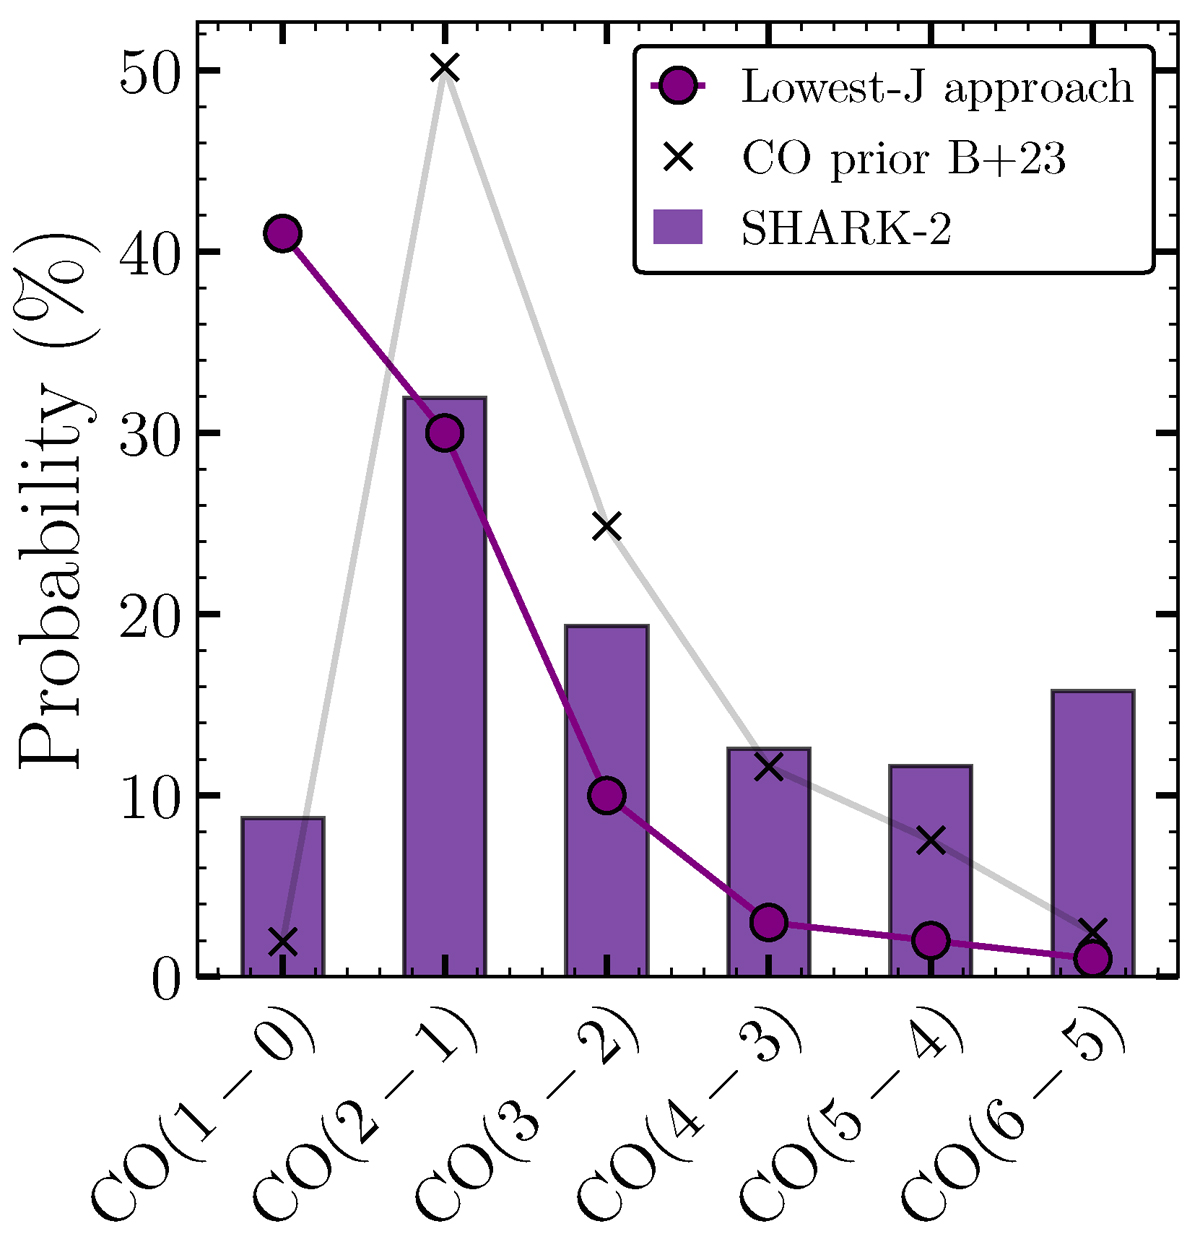
Probability distribution of all the CO detections in our sample. Given the measured properties of each emission line, we estimated redshifts using a probabilistic approach, based on the semi-analytical model, SHARK-2 (Lagos et al. 2024) (see Sect. 3.4.1). Overall, the CO(2–1) transition is the most likely to be detected in our sample, while the CO(1–0) transition is the least likely. This probability is carried into the further analysis. For comparison, we also include the CO prior redshift distribution association of sources with HST counterparts reported in Boogaard et al. (2023), written as B+23, and the probability distribution obtained adopting the lowest-J approach explained in Sect. 4.5.
Current usage metrics show cumulative count of Article Views (full-text article views including HTML views, PDF and ePub downloads, according to the available data) and Abstracts Views on Vision4Press platform.
Data correspond to usage on the plateform after 2015. The current usage metrics is available 48-96 hours after online publication and is updated daily on week days.
Initial download of the metrics may take a while.