Fig. 2.
Download original image
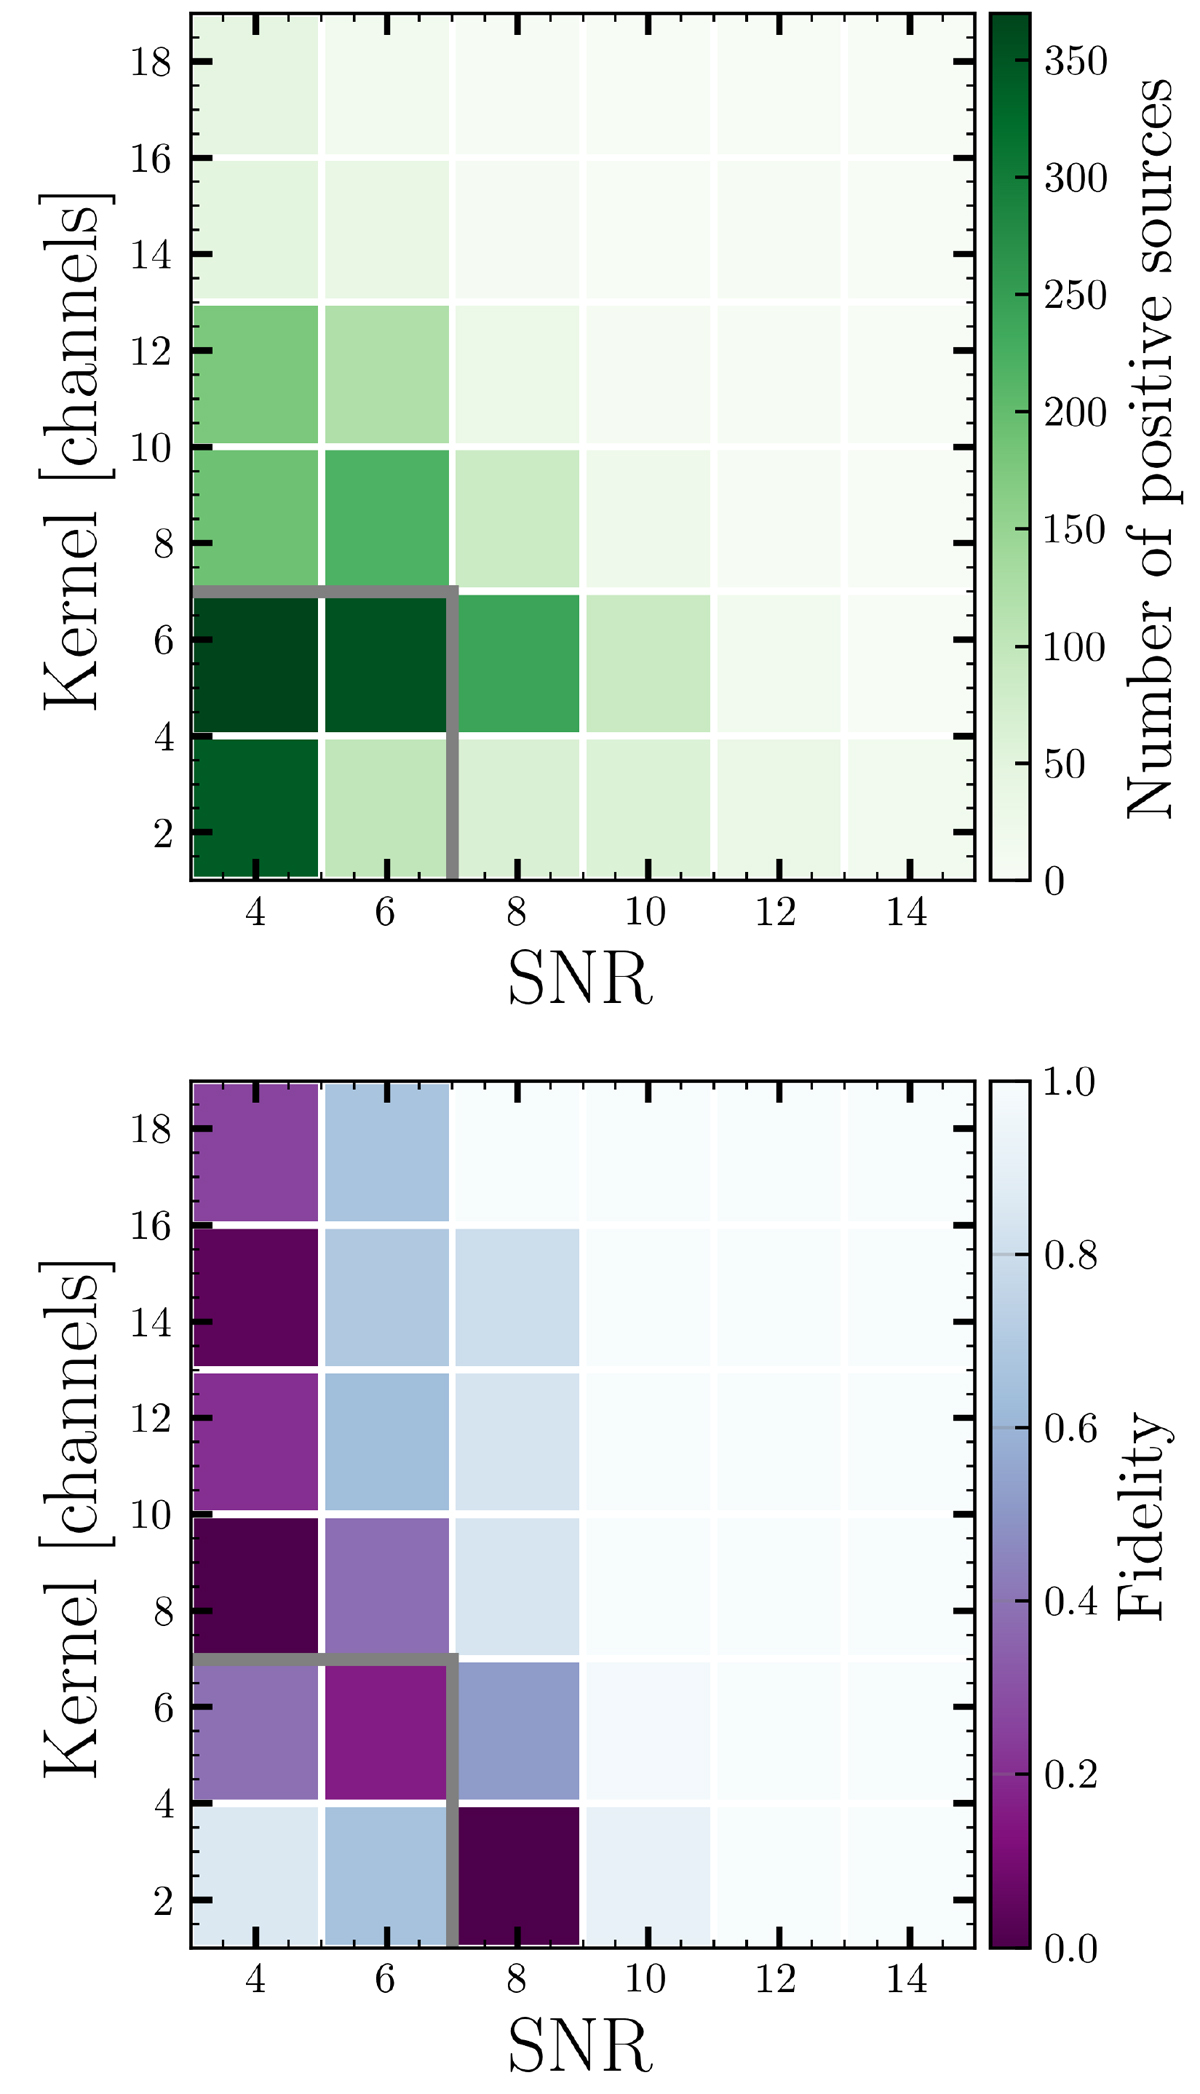
Top: 2D histogram of the number of positive sources detected in all the data cubes when searching for emission lines using SoFiA2. The x axis represents the S/N of the line and the y axis shows the number of channels spanned by each detection. Bottom: fidelity grid derived from Eq. (1) considering the number of positive and negative sources found for a given combination of S/N and number of channels. Values close to unity represent the highest fidelity, while zero represents the least reliable parameters. Lines with S/N above seven and spanning about seven channels usually have high fidelity values, i.e. beyond the grey lines of both panels.
Current usage metrics show cumulative count of Article Views (full-text article views including HTML views, PDF and ePub downloads, according to the available data) and Abstracts Views on Vision4Press platform.
Data correspond to usage on the plateform after 2015. The current usage metrics is available 48-96 hours after online publication and is updated daily on week days.
Initial download of the metrics may take a while.