Fig. 11.
Download original image
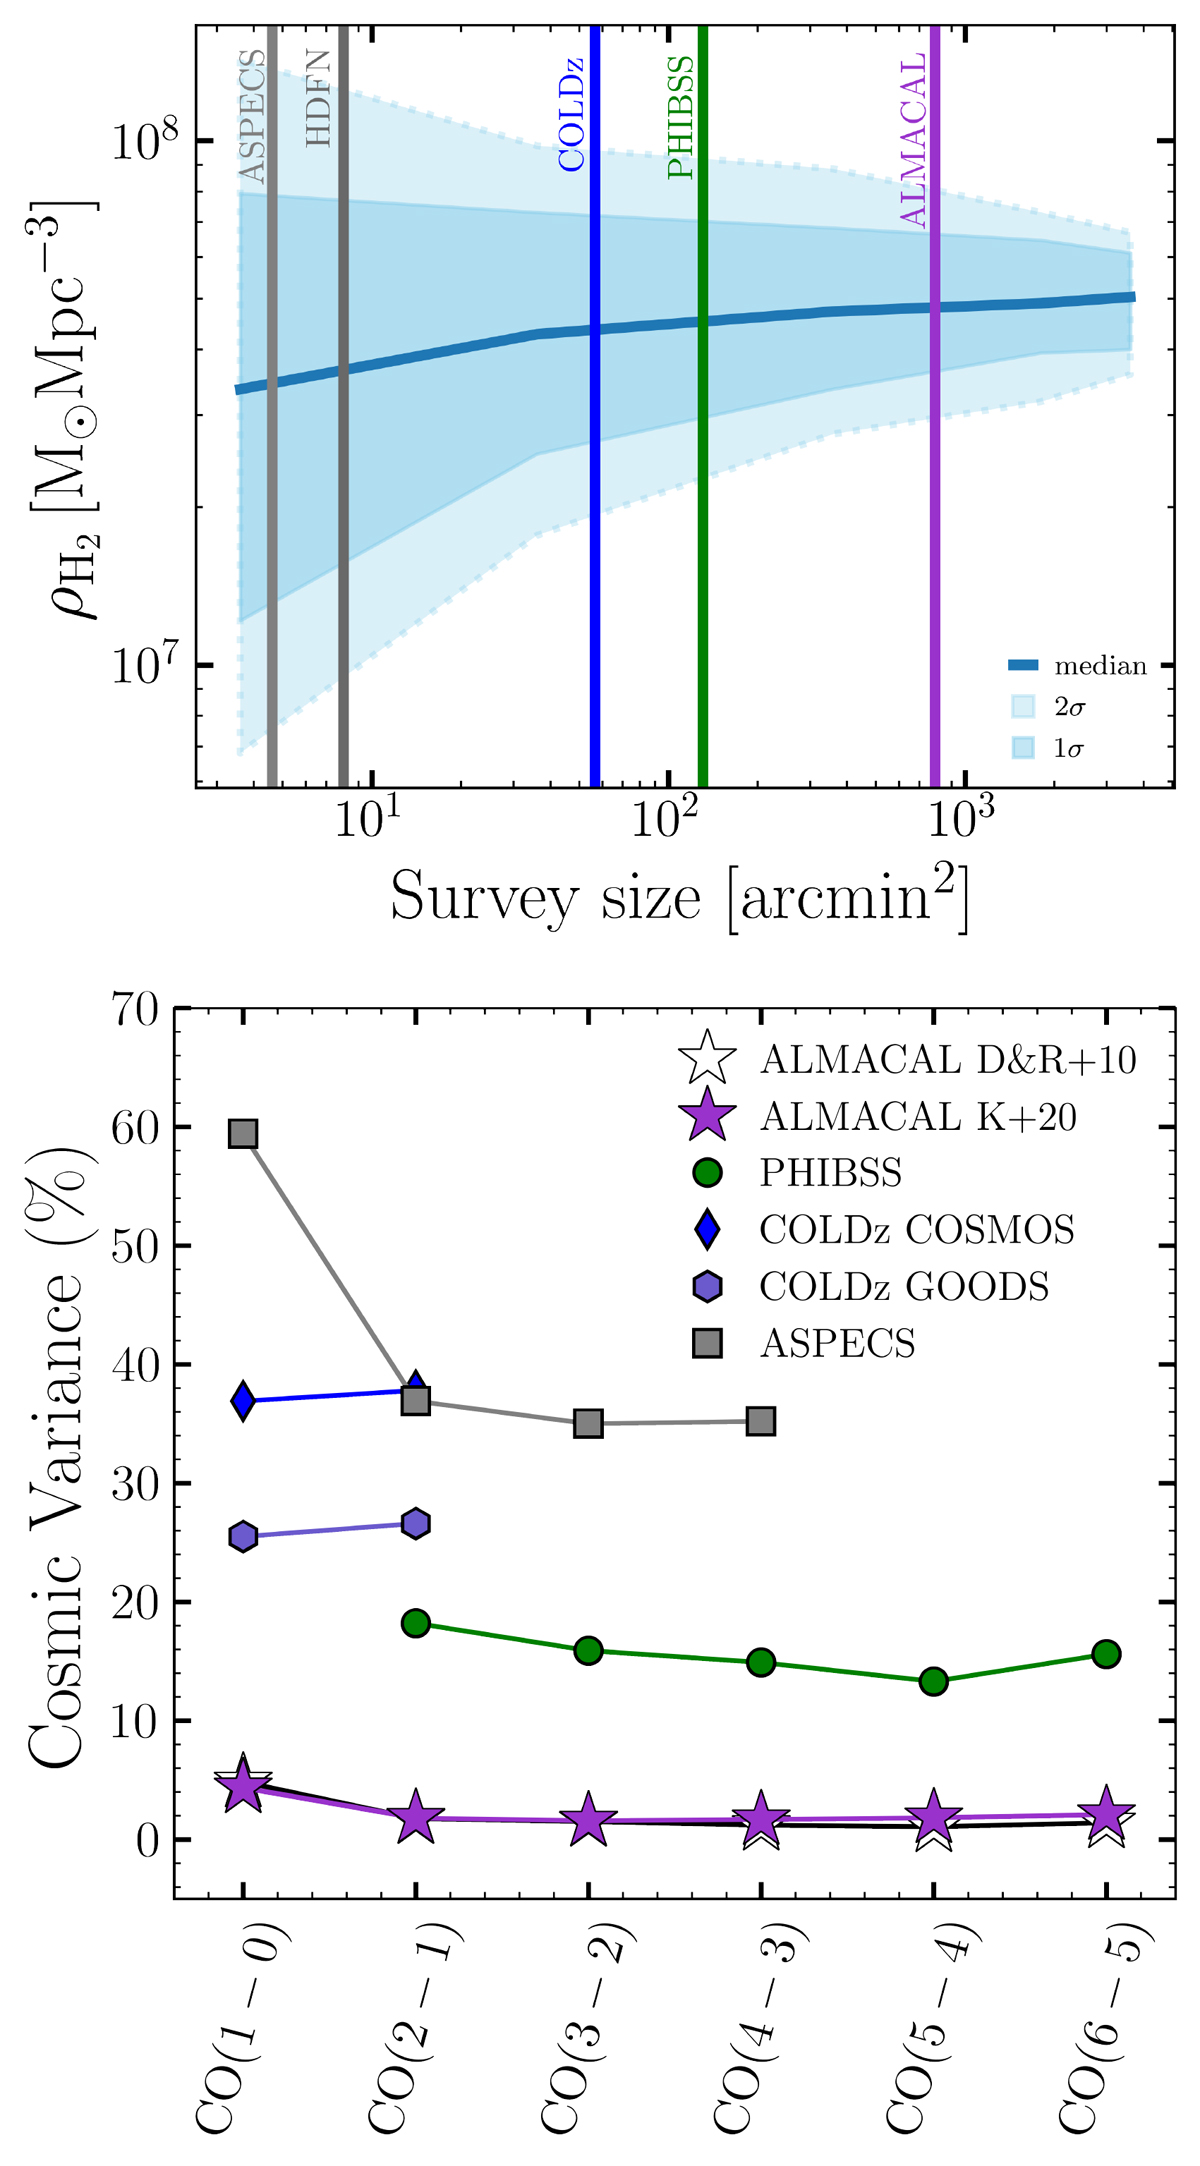
Top: effect of cosmic variance based purely on the survey size. We show the results of the molecular gas mass density variation derived from the SIDES simulation (Béthermin et al. 2022; Gkogkou et al. 2022), publicly available for J = 2 at redshifts z = 0.5–6. The solid blue line indicates the median value of ρH2, and the dark and light areas represent the 1σ and 2σ variation due to the cosmic variance. We plot the area covered by ALMACAL-22 along with other CO surveys that have measured the molecular gas mass density. Overall, ALMACAL-22 is the survey less affected by cosmic variance to date. Bottom: cosmic variance estimation of ALMACAL-22 survey in purple, based on Driver & Robotham 2010 (D&R+10), for different CO transitions (Table 1). We also plot the variance derived from the formula presented by Keenan et al. (2020) (K+20), which agrees with the previous prescription. The figure shows estimates from ASPECS (Decarli et al. 2019, 2020), PHIBSS (Lenkić et al. 2020), COLDz GOODS and COSMOS (Pavesi et al. 2018; Riechers et al. 2019), previously reported in Lenkić et al. (2020). For every CO transition, ALMACAL-22 has the lowest effect of field-to-field variance (≲5%).
Current usage metrics show cumulative count of Article Views (full-text article views including HTML views, PDF and ePub downloads, according to the available data) and Abstracts Views on Vision4Press platform.
Data correspond to usage on the plateform after 2015. The current usage metrics is available 48-96 hours after online publication and is updated daily on week days.
Initial download of the metrics may take a while.