Fig. 1.
Download original image
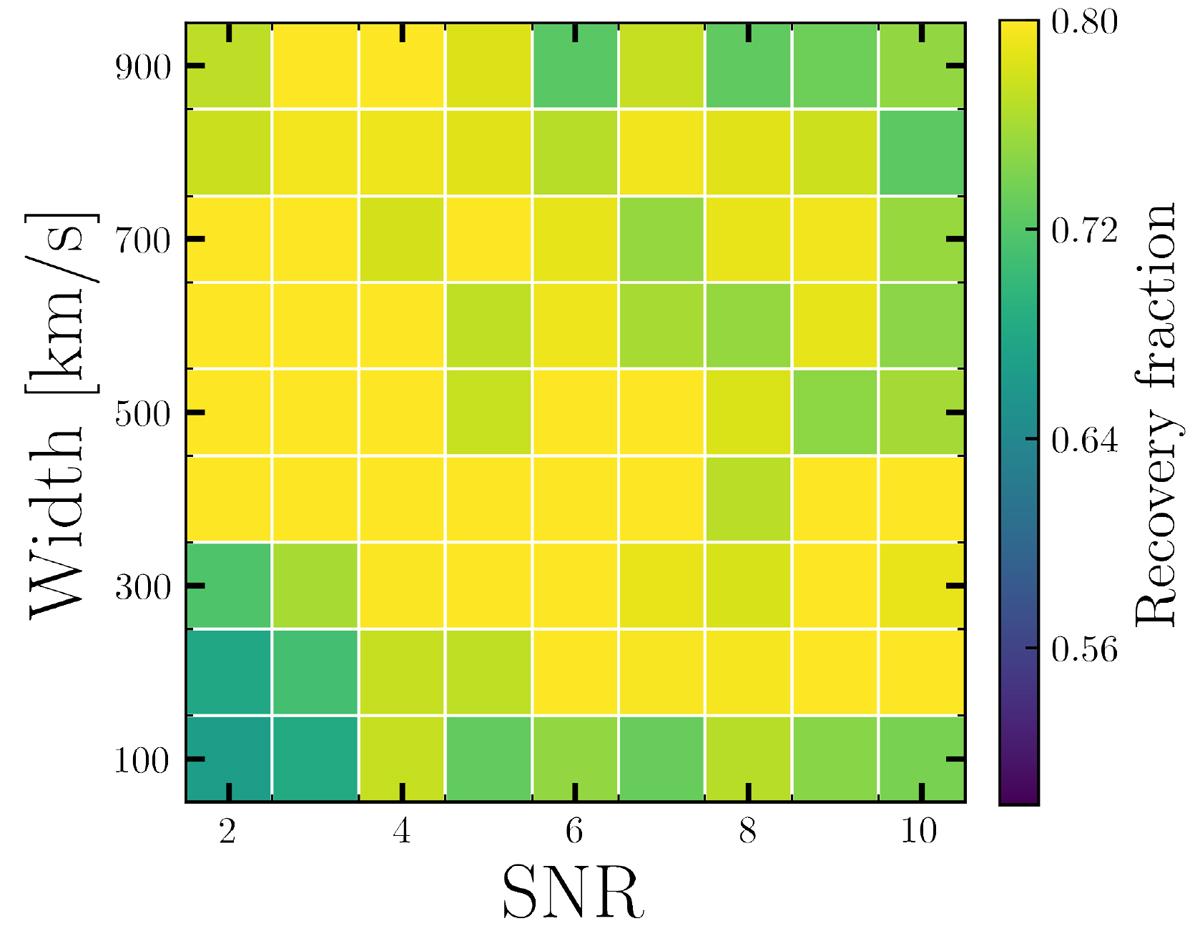
Completeness fraction of mock sources. The grid shows several combinations of the injected peak signal-to-noise ratio (S/N) and line width. The heat map represents how successfully the algorithm, SoFiA2 (Westmeier et al. 2021), detects mock sources injected into data cubes, with the recovery fraction indicated by the colour. For sources with S/N ≳ 4 and line width ≳300 km s−1 we reach a completeness above ∼75%.
Current usage metrics show cumulative count of Article Views (full-text article views including HTML views, PDF and ePub downloads, according to the available data) and Abstracts Views on Vision4Press platform.
Data correspond to usage on the plateform after 2015. The current usage metrics is available 48-96 hours after online publication and is updated daily on week days.
Initial download of the metrics may take a while.