Fig. 9
Download original image
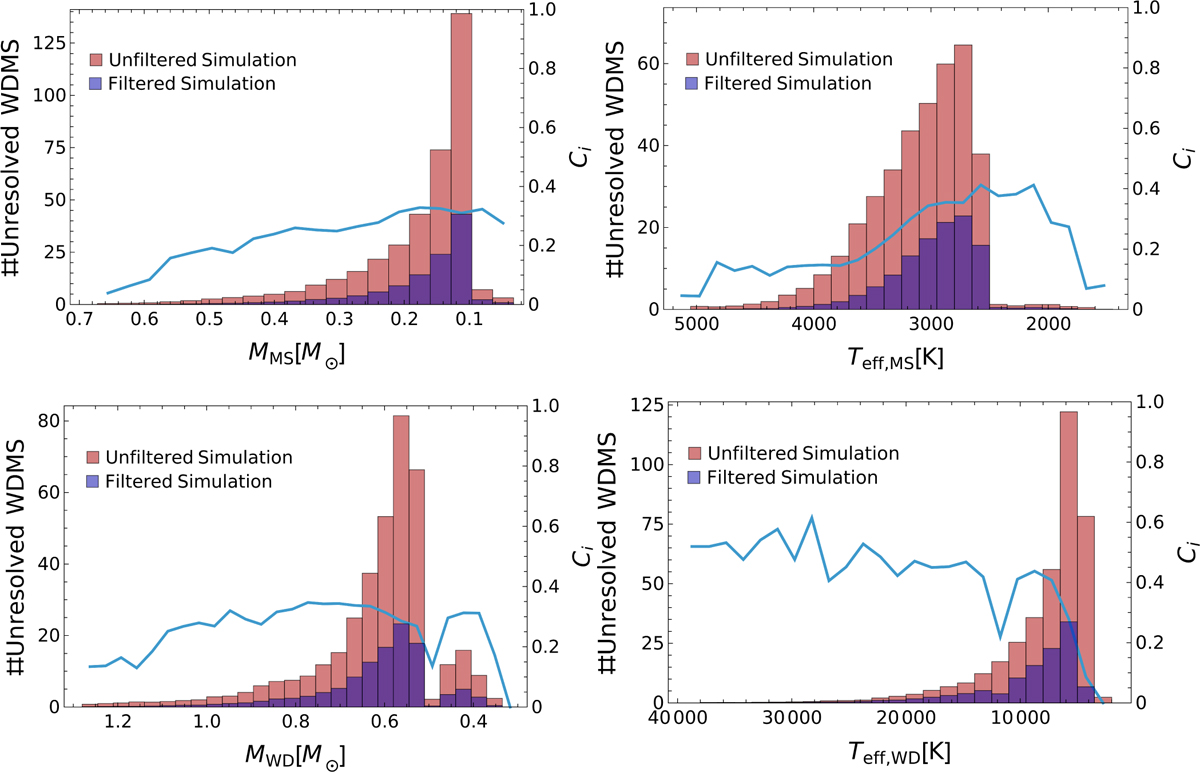
Mass (and effective temperature distribution (left and right panels, respectively) of the main-sequence (top panels) and white dwarf (bottom panels) components of the unresolved synthetic systems, with (blue) and without (red) applying the observational filtering. The blue curves (right Y-axis) represent the completeness of each bin, i, in the distribution, obtained as Ci = Nfiltered/Nunfiltered. Mean values from a total of 100 realizations of our reference model were used.
Current usage metrics show cumulative count of Article Views (full-text article views including HTML views, PDF and ePub downloads, according to the available data) and Abstracts Views on Vision4Press platform.
Data correspond to usage on the plateform after 2015. The current usage metrics is available 48-96 hours after online publication and is updated daily on week days.
Initial download of the metrics may take a while.