Open Access
Fig. 7
Download original image
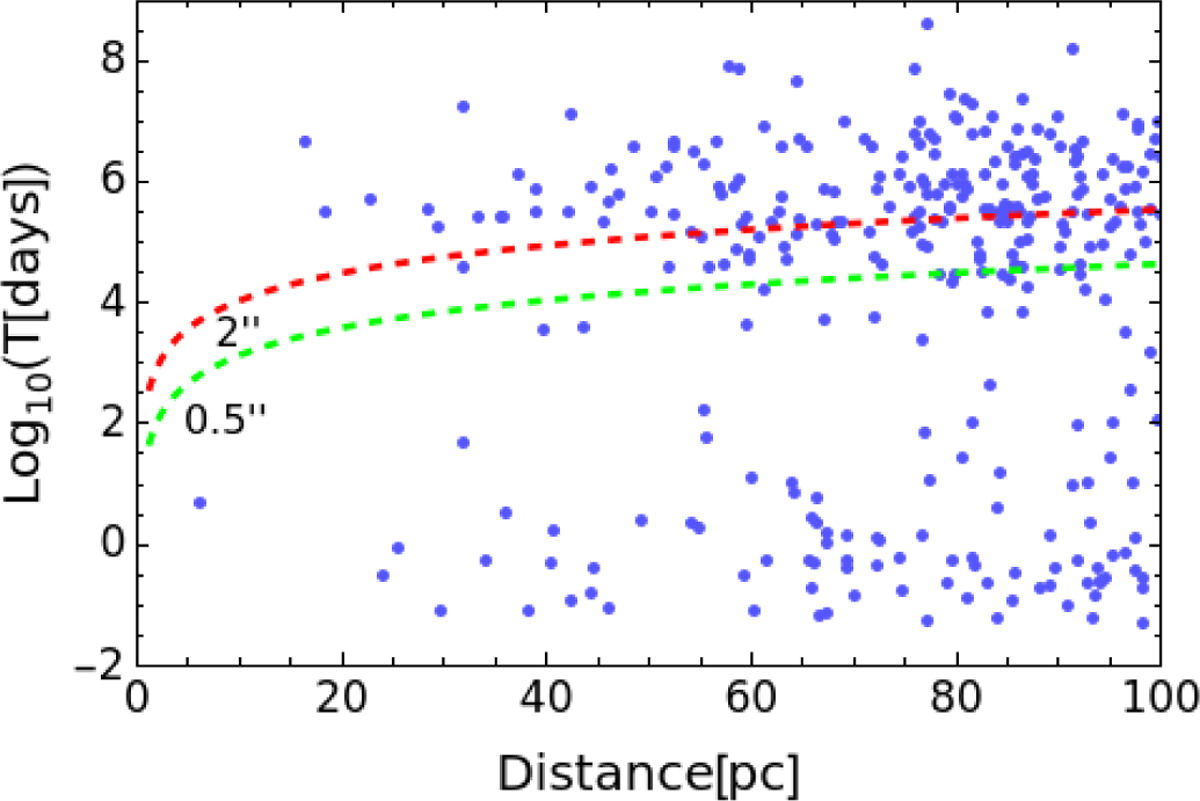
Distribution of the period versus the distance for the final simulated unresolved WDMS sample represented in Fig. 6. Also plotted are the nominal Gaia angular resolution limit (0.5″; dashed green line) and the more conservative value adopted in our analysis (2″; dashed red line).
Current usage metrics show cumulative count of Article Views (full-text article views including HTML views, PDF and ePub downloads, according to the available data) and Abstracts Views on Vision4Press platform.
Data correspond to usage on the plateform after 2015. The current usage metrics is available 48-96 hours after online publication and is updated daily on week days.
Initial download of the metrics may take a while.