Fig. B.2
Download original image
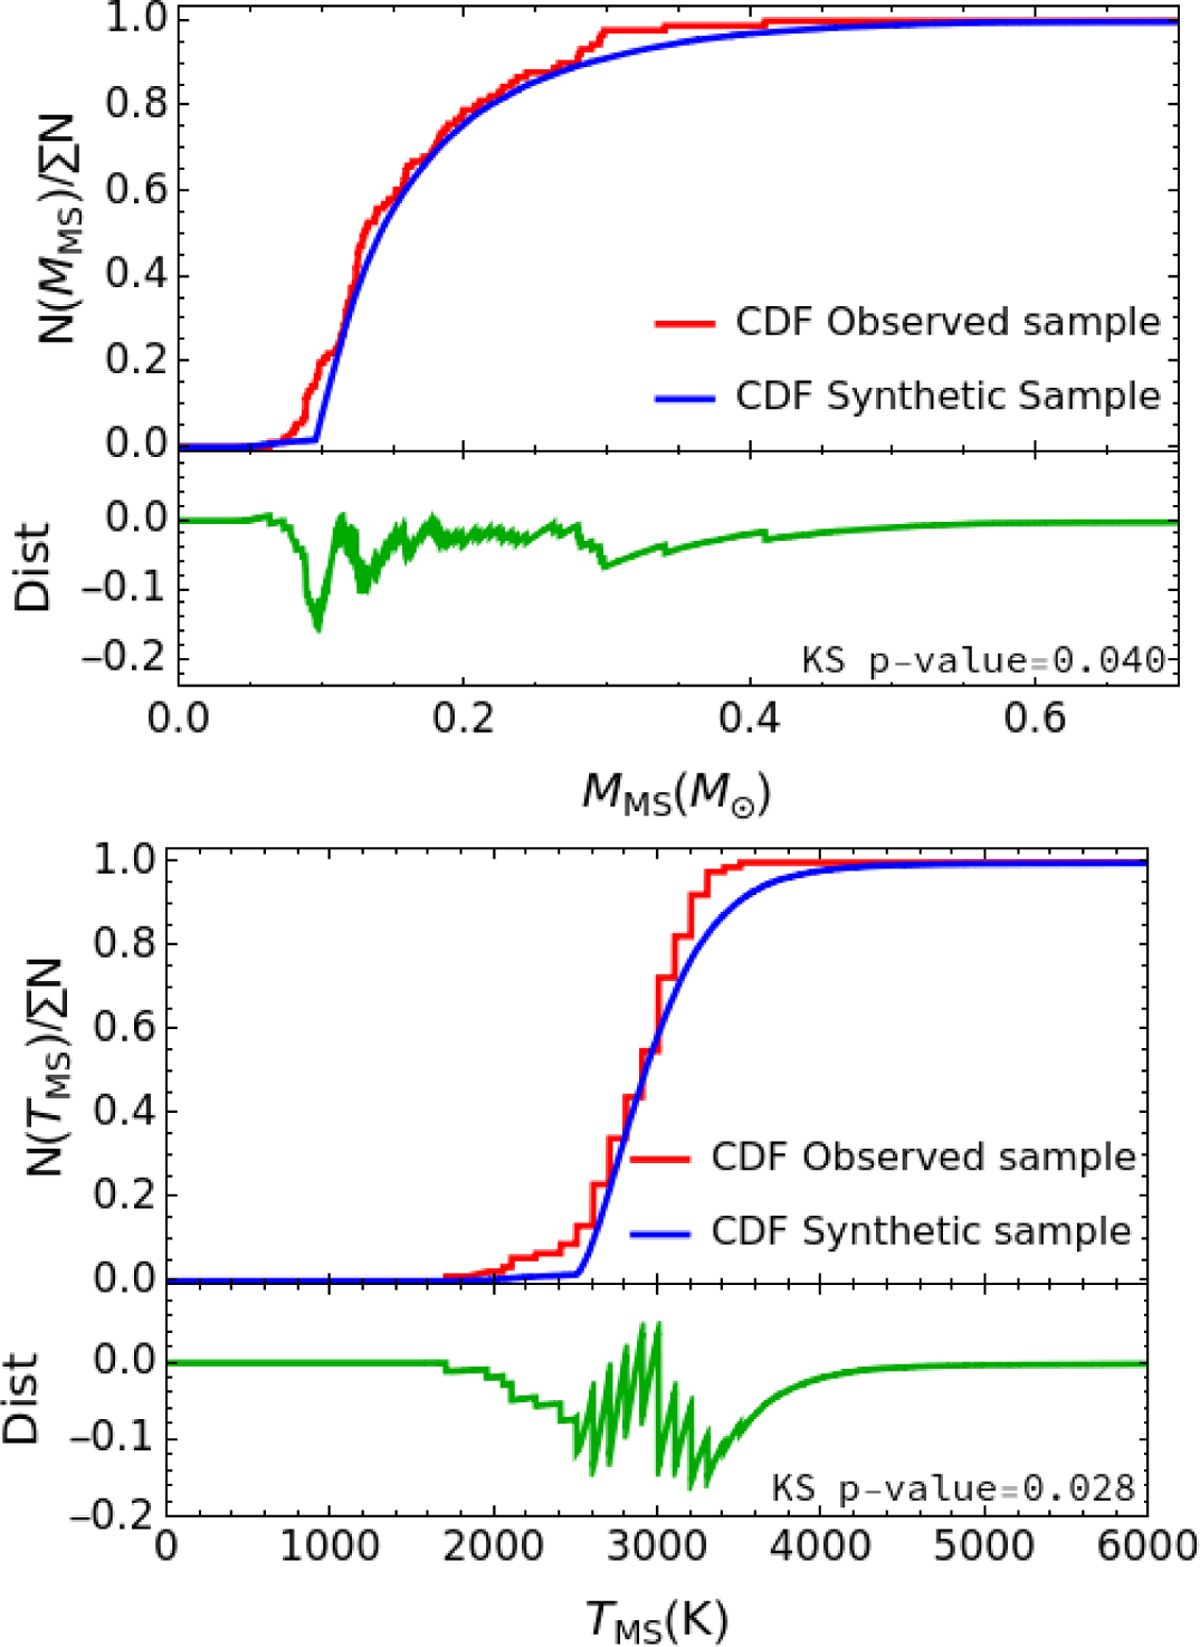
KS tests for mass (top) and effective temperatures (bottom). In each panel, the top subpanels represents the cumulative distribution function (CDF) of the main-sequence component of the observed Gaia sample (Rebassa-Mansergas et al. 2021b, red line) and the synthetic sample (blue line), and the bottom subpanels display the distance (DIST; green line) between the CDFs.
Current usage metrics show cumulative count of Article Views (full-text article views including HTML views, PDF and ePub downloads, according to the available data) and Abstracts Views on Vision4Press platform.
Data correspond to usage on the plateform after 2015. The current usage metrics is available 48-96 hours after online publication and is updated daily on week days.
Initial download of the metrics may take a while.