Fig. 1
Download original image
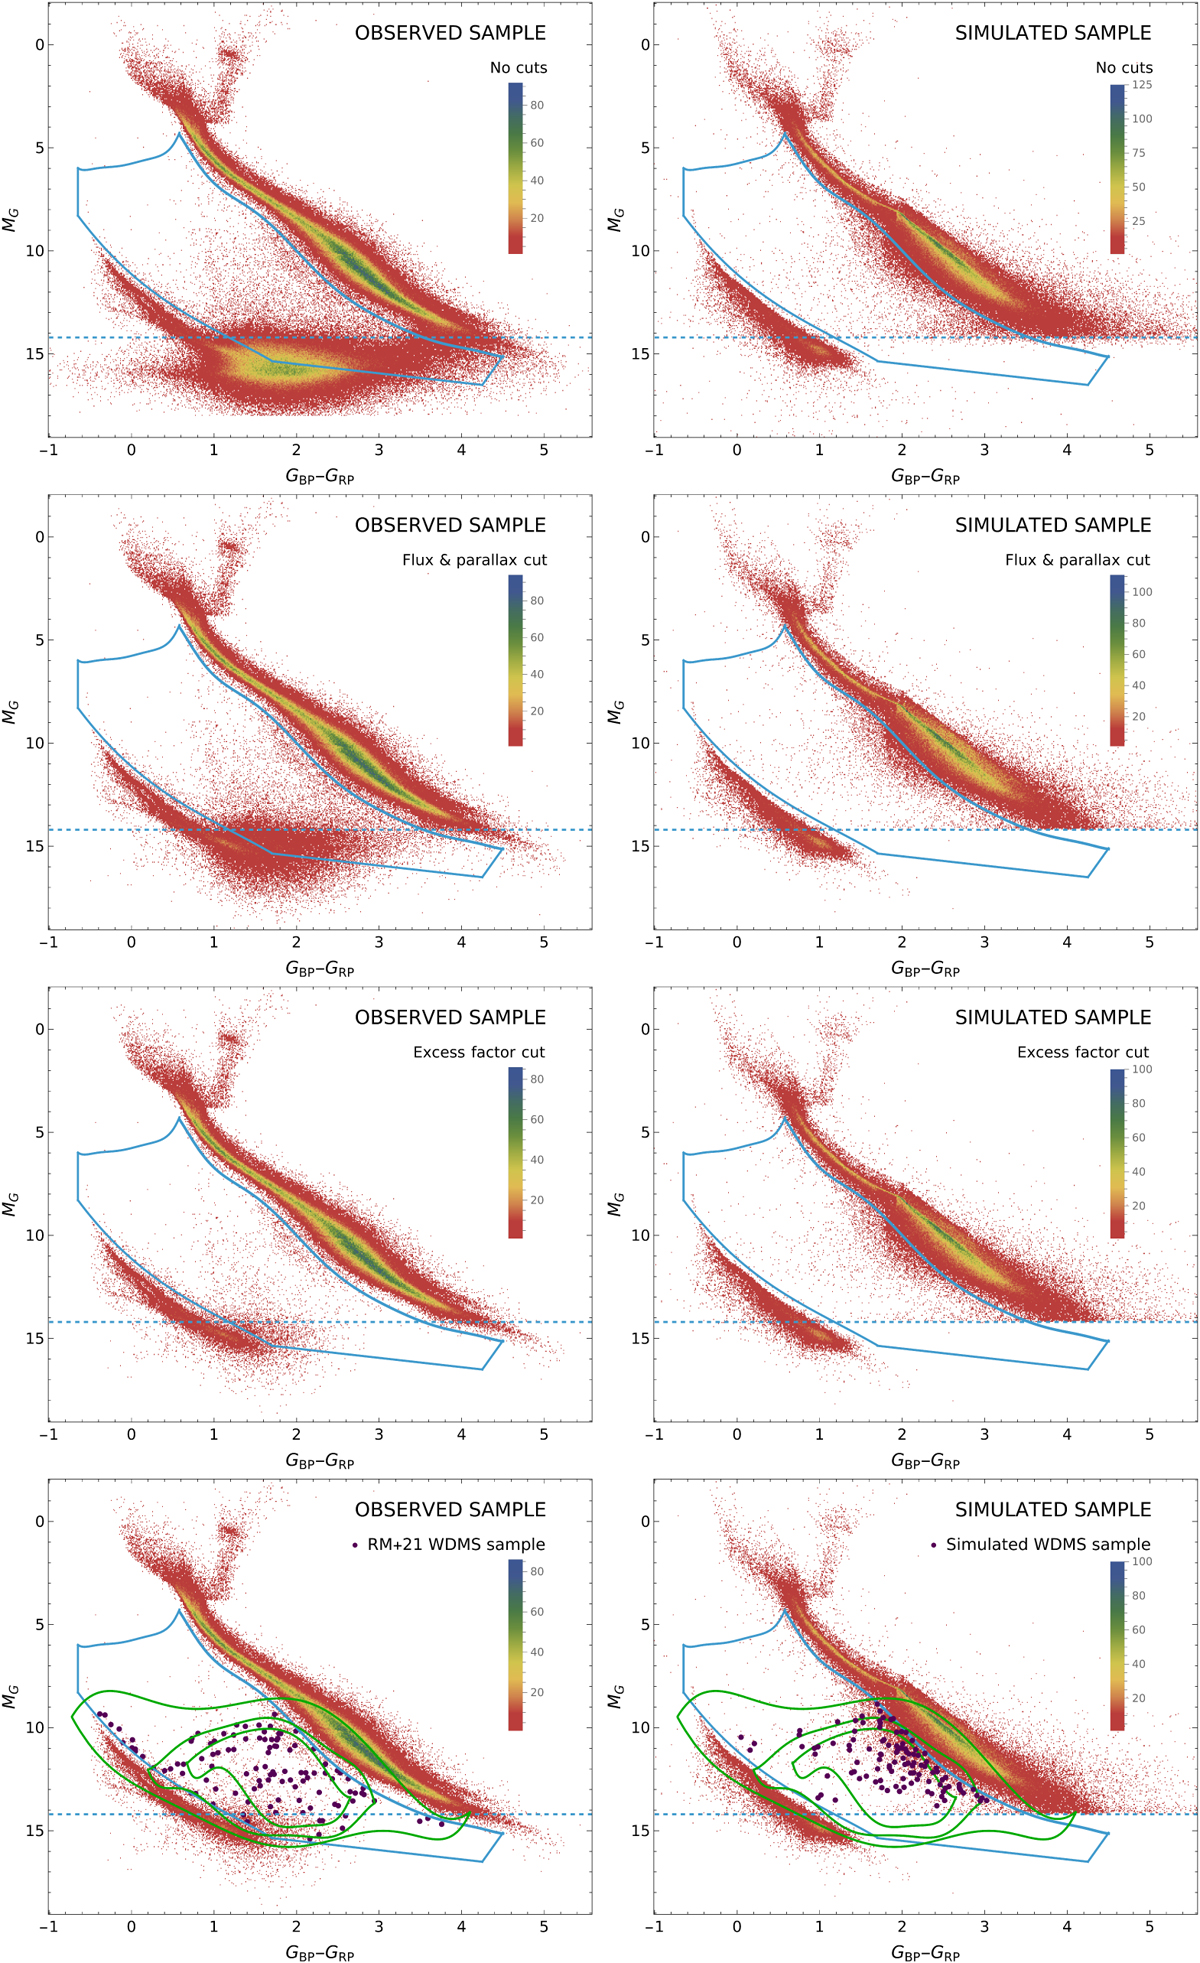
Color-magnitude diagrams for the Gaia 100 pc sample. The sample construction process is exemplified with color-magnitude diagrams for the observational sample for: the different selection phases (left panels; see Table 1); the no-cuts samples (upper panels); the flux and parallax selection (upper-middle panels); the excess factor removal (lower-middle panels); and the final WDMS sample (bottom panels). The corresponding diagrams of the simulated sample are also shown (right panels). The WDMS region (Rebassa-Mansergas et al. 2021b) is marked with a solid blue line, and the dashed blue line depicts the magnitude limit of our simulations. Finally, the selection function (green line contours corresponding to 15%, 36%, and 49%) is derived from the observed sample from Rebassa-Mansergas et al. (2021 b, bottom-left panel, magenta dots; RM+21) and applied to a typical synthetic realization (bottom-right panel, magenta dots).
Current usage metrics show cumulative count of Article Views (full-text article views including HTML views, PDF and ePub downloads, according to the available data) and Abstracts Views on Vision4Press platform.
Data correspond to usage on the plateform after 2015. The current usage metrics is available 48-96 hours after online publication and is updated daily on week days.
Initial download of the metrics may take a while.